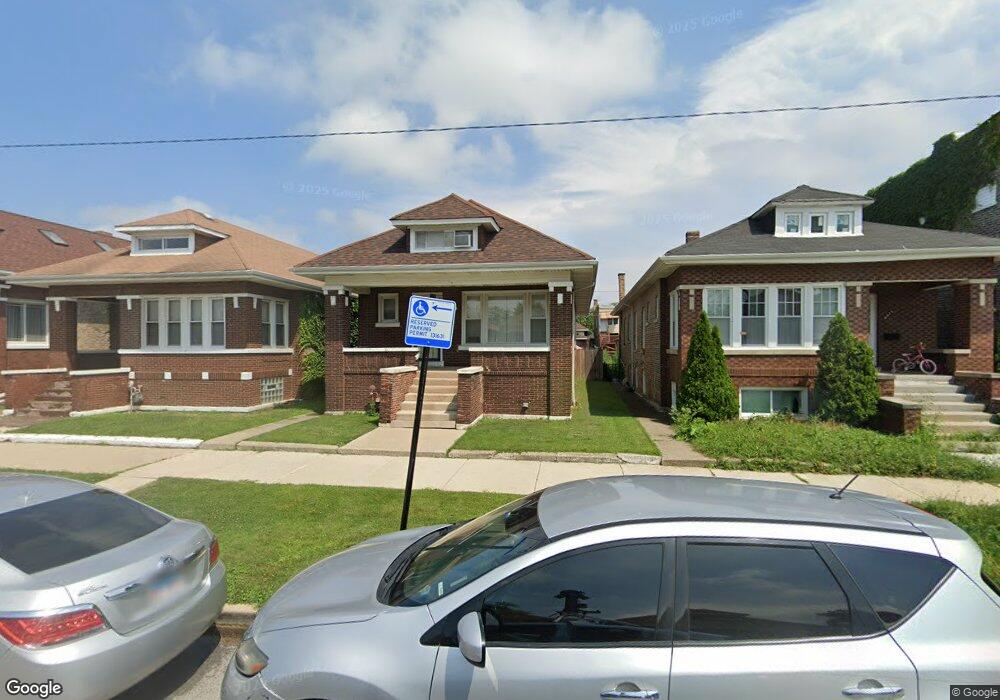
8015 S Ada St Chicago, IL 60620
Auburn Gresham NeighborhoodEstimated Value: $171,663 - $206,000
4
Beds
1
Bath
1,080
Sq Ft
$175/Sq Ft
Est. Value
About This Home
This home is located at 8015 S Ada St, Chicago, IL 60620 and is currently estimated at $189,166, approximately $175 per square foot. 8015 S Ada St is a home located in Cook County with nearby schools including Cook Elementary School, Emil G. Hirsch Metropolitan High School, and LEARN Hunter Perkins.
Ownership History
Date
Name
Owned For
Owner Type
Purchase Details
Closed on
Jul 18, 2005
Sold by
Harris Na
Bought by
Walls Foster Danielle T
Current Estimated Value
Home Financials for this Owner
Home Financials are based on the most recent Mortgage that was taken out on this home.
Original Mortgage
$129,200
Outstanding Balance
$71,449
Interest Rate
6.9%
Mortgage Type
Unknown
Estimated Equity
$117,717
Purchase Details
Closed on
Mar 20, 2005
Sold by
Bank One Na
Bought by
Harris Trust & Savings #4010
Purchase Details
Closed on
Mar 8, 2005
Sold by
Jackson Larry S
Bought by
Bank One Na and Structured Asset Securities Corp Amortiz
Purchase Details
Closed on
Jun 3, 2004
Sold by
Jackson Larry S
Bought by
Jackson Larry S
Purchase Details
Closed on
Feb 23, 2004
Sold by
Jackson Larry
Bought by
Game Shape International Holding Co
Purchase Details
Closed on
Feb 19, 2002
Sold by
Griffin Ernest L and Griffin Ada
Bought by
Jackson Larry
Create a Home Valuation Report for This Property
The Home Valuation Report is an in-depth analysis detailing your home's value as well as a comparison with similar homes in the area
Home Values in the Area
Average Home Value in this Area
Purchase History
| Date | Buyer | Sale Price | Title Company |
|---|---|---|---|
| Walls Foster Danielle T | $161,500 | First American Title | |
| Harris Trust & Savings #4010 | $70,500 | First American Title | |
| Bank One Na | -- | First American Title | |
| Jackson Larry S | -- | -- | |
| Game Shape International Holding Co | -- | -- | |
| Jackson Larry | $127,000 | -- |
Source: Public Records
Mortgage History
| Date | Status | Borrower | Loan Amount |
|---|---|---|---|
| Open | Walls Foster Danielle T | $129,200 |
Source: Public Records
Tax History
| Year | Tax Paid | Tax Assessment Tax Assessment Total Assessment is a certain percentage of the fair market value that is determined by local assessors to be the total taxable value of land and additions on the property. | Land | Improvement |
|---|---|---|---|---|
| 2025 | $883 | $7,300 | $2,000 | $5,300 |
| 2024 | $883 | $7,300 | $2,000 | $5,300 |
| 2023 | $839 | $7,500 | $2,600 | $4,900 |
| 2022 | $839 | $7,500 | $2,600 | $4,900 |
| 2021 | $838 | $7,500 | $2,600 | $4,900 |
| 2020 | $1,466 | $9,683 | $2,600 | $7,083 |
| 2019 | $1,449 | $10,641 | $2,600 | $8,041 |
| 2018 | $1,423 | $10,641 | $2,600 | $8,041 |
| 2017 | $1,608 | $10,843 | $2,400 | $8,443 |
| 2016 | $1,672 | $10,843 | $2,400 | $8,443 |
| 2015 | $1,506 | $10,843 | $2,400 | $8,443 |
| 2014 | $1,443 | $10,345 | $2,200 | $8,145 |
| 2013 | $1,403 | $10,345 | $2,200 | $8,145 |
Source: Public Records
Map
Nearby Homes
- 8011 S Ada St
- 8025 S Loomis Blvd
- 8029 S Loomis Blvd
- 7938 S Throop St
- 8024 S Loomis Blvd
- 7938 S Loomis Blvd
- 8111 S Throop St
- 8133 S Loomis Blvd
- 8137 S Loomis Blvd
- 8144 S Ada St
- 8151 S Ada St
- 8004 S May St
- 8040 S May St
- 8018 S Laflin St
- 7914 S May St
- 7824 S Loomis Blvd
- 8015 S May St
- 7817 S Loomis Blvd
- 8047 S Justine St
- 7810 S Throop St
- 8011 S Ada St
- 8025 S Ada St Unit 1
- 8025 S Ada St
- 8025 S Ada St Unit 2
- 8009 S Ada St
- 8027 S Ada St
- 8005 S Ada St
- 8005 S Ada St Unit 2
- 8029 S Ada St
- 8016 S Throop St
- 8001 S Ada St
- 8014 S Throop St
- 8020 S Throop St Unit 1
- 8012 S Throop St
- 8012 S Throop St Unit 1
- 8012 S Throop St Unit 2
- 8031 S Ada St
- 8006 S Throop St
- 8008 S Throop St
- 8008 S Throop St
Your Personal Tour Guide
Ask me questions while you tour the home.