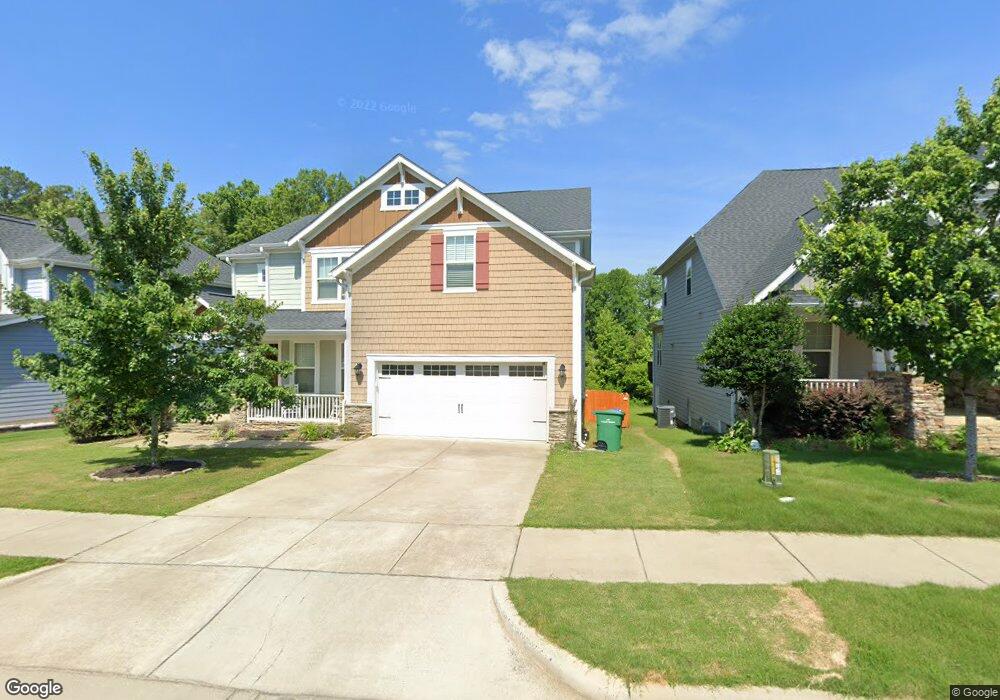
8016 Hergety Dr Raleigh, NC 27603
Estimated Value: $557,000 - $648,000
5
Beds
4
Baths
3,554
Sq Ft
$170/Sq Ft
Est. Value
About This Home
This home is located at 8016 Hergety Dr, Raleigh, NC 27603 and is currently estimated at $604,550, approximately $170 per square foot. 8016 Hergety Dr is a home located in Wake County with nearby schools including Smith Elementary, North Garner Middle, and Middle Creek High.
Ownership History
Date
Name
Owned For
Owner Type
Purchase Details
Closed on
Nov 18, 2020
Sold by
Jones Keith R and Jones Amanda R
Bought by
Biggs Joseph Hosea and Biggs Anita P
Current Estimated Value
Home Financials for this Owner
Home Financials are based on the most recent Mortgage that was taken out on this home.
Original Mortgage
$429,191
Interest Rate
6.95%
Mortgage Type
New Conventional
Purchase Details
Closed on
May 8, 2017
Sold by
Pendergraph Frankie and Reilly Tyler
Bought by
Jones Keith R and Jones Amanda R
Home Financials for this Owner
Home Financials are based on the most recent Mortgage that was taken out on this home.
Original Mortgage
$339,500
Interest Rate
4.08%
Mortgage Type
VA
Purchase Details
Closed on
Mar 30, 2016
Sold by
Beazer Homes Corp
Bought by
Pendergraph Frankie and Pendergraph Tyler Lea
Create a Home Valuation Report for This Property
The Home Valuation Report is an in-depth analysis detailing your home's value as well as a comparison with similar homes in the area
Home Values in the Area
Average Home Value in this Area
Purchase History
| Date | Buyer | Sale Price | Title Company |
|---|---|---|---|
| Biggs Joseph Hosea | $425,000 | None Listed On Document | |
| Jones Keith R | $339,500 | None Available | |
| Pendergraph Frankie | $357,000 | None Available |
Source: Public Records
Mortgage History
| Date | Status | Borrower | Loan Amount |
|---|---|---|---|
| Previous Owner | Biggs Joseph Hosea | $429,191 | |
| Previous Owner | Jones Keith R | $339,500 |
Source: Public Records
Tax History Compared to Growth
Tax History
| Year | Tax Paid | Tax Assessment Tax Assessment Total Assessment is a certain percentage of the fair market value that is determined by local assessors to be the total taxable value of land and additions on the property. | Land | Improvement |
|---|---|---|---|---|
| 2025 | $5,134 | $584,399 | $100,000 | $484,399 |
| 2024 | $5,113 | $584,399 | $100,000 | $484,399 |
| 2023 | $4,287 | $383,713 | $55,000 | $328,713 |
| 2022 | $4,028 | $383,713 | $55,000 | $328,713 |
| 2021 | $3,838 | $383,713 | $55,000 | $328,713 |
| 2020 | $3,838 | $383,713 | $55,000 | $328,713 |
| 2019 | $3,874 | $334,209 | $60,000 | $274,209 |
| 2018 | $3,653 | $334,209 | $60,000 | $274,209 |
| 2017 | $3,521 | $334,209 | $60,000 | $274,209 |
| 2016 | $3,472 | $334,209 | $60,000 | $274,209 |
Source: Public Records
Map
Nearby Homes
- 2000 Ginseng Ln
- 105 Tawny Slope Ct Unit 14
- 105 Tawny Slope Ct
- 1017 Travern Dr
- 109 Tawny Slope Ct Unit 13
- 109 Tawny Slope Ct
- 117 Tawny Slope Ct Unit 47
- 121 Tawny Slope Ct Unit 46
- 0 Ten Rd Unit 10118279
- 130 Tawny Slope Ct Unit 19
- 130 Tawny Slope Ct
- 5008 Megara Run
- 5009 Megara Run
- 173 Tawny Slope Ct
- 8604 Lobelia St
- 372 Amber Acorn Ave
- 342 Amber Acorn Ave
- 3916 W Allen St
- 5702 Volos Ave
- 7625 Fayetteville Rd
- 8012 Hergety Dr
- 8020 Hergety Dr
- 8024 Hergety Dr
- 8005 Hergety Dr
- 8004 Hergety Dr
- 8013 Hergety Dr
- 8028 Hergety Dr
- 8009 Hergety Dr
- 2033 Ginseng Ln
- 8032 Hergety Dr
- 8001 Hergety Dr
- 2020 Ginseng Ln
- 2029 Ginseng Ln
- 8026 Hergety Dr
- 1028 Topans Dr Unit Lot 65
- 1028 Topans Dr
- 8036 Hergety Dr
- 1036 Topans Dr
- 2016 Ginseng Ln
- 2040 Ernesto Ln