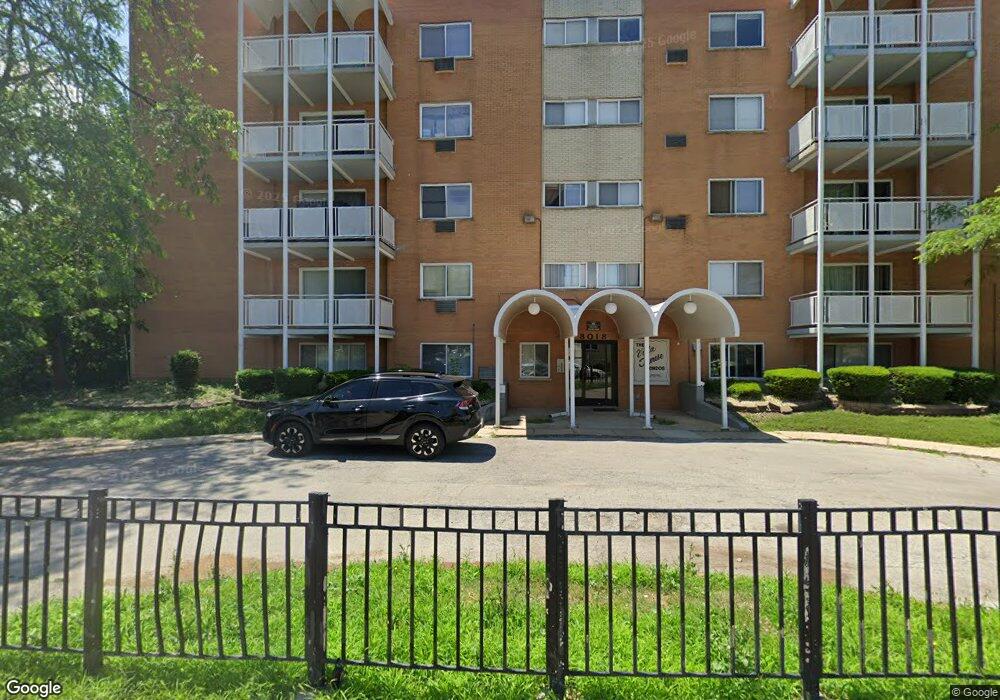
8016 S Hoyne Ave Unit 3 Chicago, IL 60620
Auburn Gresham NeighborhoodEstimated Value: $31,000 - $126,000
--
Bed
--
Bath
--
Sq Ft
1.01
Acres
About This Home
This home is located at 8016 S Hoyne Ave Unit 3, Chicago, IL 60620 and is currently estimated at $64,234. 8016 S Hoyne Ave Unit 3 is a home located in Cook County with nearby schools including Joplin Elementary School, Bogan Computer Technical High School, and LEARN Hunter Perkins.
Ownership History
Date
Name
Owned For
Owner Type
Purchase Details
Closed on
Apr 11, 2022
Sold by
Hooks Ramon and Hooks Y
Bought by
Hooks Rashad and Hooks Y
Current Estimated Value
Purchase Details
Closed on
Jan 28, 2022
Sold by
Hooks Ramon
Bought by
Hooks Rashad
Purchase Details
Closed on
Nov 2, 2020
Sold by
Mbr Real Estate Llc
Bought by
Hooks Ramon
Purchase Details
Closed on
Jun 6, 2011
Sold by
Federal National Mortgage Association
Bought by
Mbr Real Estate Llc
Purchase Details
Closed on
Jun 9, 2010
Sold by
Bucholtz Christopher R
Bought by
Federal National Mortgage Association
Purchase Details
Closed on
Aug 3, 2001
Sold by
Metropolitan Bank & Trust
Bought by
Bucholtz Christopher R
Home Financials for this Owner
Home Financials are based on the most recent Mortgage that was taken out on this home.
Original Mortgage
$37,900
Interest Rate
7.03%
Mortgage Type
Purchase Money Mortgage
Create a Home Valuation Report for This Property
The Home Valuation Report is an in-depth analysis detailing your home's value as well as a comparison with similar homes in the area
Home Values in the Area
Average Home Value in this Area
Purchase History
| Date | Buyer | Sale Price | Title Company |
|---|---|---|---|
| Hooks Rashad | -- | -- | |
| Hooks Rashad | -- | None Listed On Document | |
| Hooks Rashad | -- | None Listed On Document | |
| Hooks Ramon | $15,000 | Attorney | |
| Mbr Real Estate Llc | $6,000 | Attorneys Title Guaranty Fun | |
| Federal National Mortgage Association | -- | None Available | |
| Bucholtz Christopher R | $40,000 | -- |
Source: Public Records
Mortgage History
| Date | Status | Borrower | Loan Amount |
|---|---|---|---|
| Previous Owner | Bucholtz Christopher R | $37,900 |
Source: Public Records
Tax History Compared to Growth
Tax History
| Year | Tax Paid | Tax Assessment Tax Assessment Total Assessment is a certain percentage of the fair market value that is determined by local assessors to be the total taxable value of land and additions on the property. | Land | Improvement |
|---|---|---|---|---|
| 2024 | $422 | $1,807 | $341 | $1,466 |
| 2023 | $411 | $2,000 | $545 | $1,455 |
| 2022 | $411 | $2,000 | $545 | $1,455 |
| 2021 | $402 | $1,999 | $544 | $1,455 |
| 2020 | $534 | $2,399 | $544 | $1,855 |
| 2019 | $533 | $2,654 | $544 | $2,110 |
| 2018 | $524 | $2,654 | $544 | $2,110 |
| 2017 | $520 | $2,416 | $476 | $1,940 |
| 2016 | $509 | $2,543 | $476 | $2,067 |
| 2015 | $570 | $3,110 | $476 | $2,634 |
| 2014 | $248 | $1,336 | $442 | $894 |
| 2013 | $243 | $1,336 | $442 | $894 |
Source: Public Records
Map
Nearby Homes
- 2028 W 80th St
- 2024 W 79th Place
- 2115 W 82nd Place
- 7828 S Winchester Ave
- 2321 W 81st Place
- 8220 S Wolcott Ave
- 8051 S Honore St
- 8058 S Wood St
- 8333 S Hamilton Ave
- 2142 W 77th Place
- 7843 S Honore St
- 8023 S Wood St
- 7755 S Wolcott Ave
- 7653 S Seeley Ave
- 7928 S Hermitage Ave
- 8033 S Campbell Ave
- 1818 W 78th St
- 7921 S Hermitage Ave
- 2418 W 83rd St
- 7636 S Winchester Ave
- 8016 S Hoyne Ave Unit 2
- 8016 S Hoyne Ave Unit 22
- 8016 S Hoyne Ave Unit 15
- 8016 S Hoyne Ave Unit 5
- 8016 S Hoyne Ave Unit 27
- 8016 S Hoyne Ave Unit 21
- 8016 S Hoyne Ave Unit 26
- 8016 S Hoyne Ave Unit 10
- 8016 S Hoyne Ave Unit 29
- 8016 S Hoyne Ave Unit 8
- 8016 S Hoyne Ave Unit 7
- 8016 S Hoyne Ave Unit 6
- 8016 S Hoyne Ave Unit 28
- 8016 S Hoyne Ave Unit 19
- 8016 S Hoyne Ave Unit 20
- 8016 S Hoyne Ave Unit 14
- 8016 S Hoyne Ave Unit 11
- 8016 S Hoyne Ave Unit 9
- 8018 S Hoyne Ave Unit 29
- 8018 S Hoyne Ave Unit 8