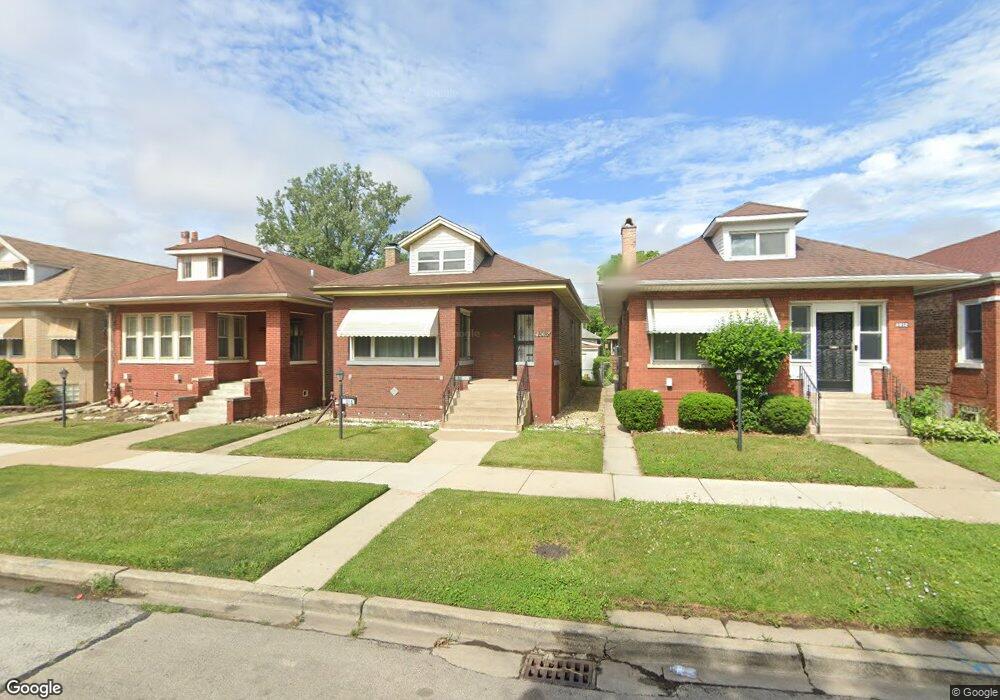
8016 S Kenwood Ave Chicago, IL 60619
Grand Crossing NeighborhoodEstimated Value: $150,000 - $233,000
3
Beds
2
Baths
1,154
Sq Ft
$158/Sq Ft
Est. Value
About This Home
This home is located at 8016 S Kenwood Ave, Chicago, IL 60619 and is currently estimated at $182,765, approximately $158 per square foot. 8016 S Kenwood Ave is a home located in Cook County with nearby schools including Emil G. Hirsch Metropolitan High School, Betty Shabazz Academy, and CICS Avalon.
Ownership History
Date
Name
Owned For
Owner Type
Purchase Details
Closed on
Apr 6, 2005
Sold by
Williams Kayode
Bought by
Williams Isbat I and Smith Isbat I
Current Estimated Value
Purchase Details
Closed on
Feb 28, 2002
Sold by
2929 N Western Ave Llc
Bought by
Bowers Debbie L
Purchase Details
Closed on
Nov 9, 2001
Sold by
Surgick Josie and Tucker Josie
Bought by
Smith Isbat I and Williams Kayode
Home Financials for this Owner
Home Financials are based on the most recent Mortgage that was taken out on this home.
Original Mortgage
$106,700
Interest Rate
6.92%
Purchase Details
Closed on
Apr 15, 1997
Sold by
Tucker Josie M and Surgick Josie
Bought by
Surgick Malachi and Surgick Josie
Home Financials for this Owner
Home Financials are based on the most recent Mortgage that was taken out on this home.
Original Mortgage
$32,000
Interest Rate
7.93%
Create a Home Valuation Report for This Property
The Home Valuation Report is an in-depth analysis detailing your home's value as well as a comparison with similar homes in the area
Home Values in the Area
Average Home Value in this Area
Purchase History
| Date | Buyer | Sale Price | Title Company |
|---|---|---|---|
| Williams Isbat I | -- | -- | |
| Bowers Debbie L | -- | Chicago Title Insurance Co | |
| Smith Isbat I | $110,000 | Ticor Title Insurance | |
| Surgick Malachi | -- | Nations Title Agency |
Source: Public Records
Mortgage History
| Date | Status | Borrower | Loan Amount |
|---|---|---|---|
| Previous Owner | Smith Isbat I | $106,700 | |
| Previous Owner | Surgick Malachi | $32,000 |
Source: Public Records
Tax History Compared to Growth
Tax History
| Year | Tax Paid | Tax Assessment Tax Assessment Total Assessment is a certain percentage of the fair market value that is determined by local assessors to be the total taxable value of land and additions on the property. | Land | Improvement |
|---|---|---|---|---|
| 2024 | $1,133 | $13,101 | $2,813 | $10,288 |
| 2023 | $1,061 | $12,001 | $4,688 | $7,313 |
| 2022 | $1,061 | $12,001 | $4,688 | $7,313 |
| 2021 | $1,207 | $11,999 | $4,687 | $7,312 |
| 2020 | $1,804 | $11,199 | $3,375 | $7,824 |
| 2019 | $1,811 | $12,444 | $3,375 | $9,069 |
| 2018 | $1,779 | $12,444 | $3,375 | $9,069 |
| 2017 | $2,344 | $14,263 | $3,000 | $11,263 |
| 2016 | $2,357 | $14,263 | $3,000 | $11,263 |
| 2015 | $2,133 | $14,263 | $3,000 | $11,263 |
| 2014 | $1,948 | $13,065 | $2,625 | $10,440 |
| 2013 | $1,898 | $13,065 | $2,625 | $10,440 |
Source: Public Records
Map
Nearby Homes
- 8101 S Kimbark Ave
- 8007 S Avalon Ave
- 8055 S Avalon Ave
- 7930 S Kenwood Ave
- 8048 S Avalon Ave
- 8035 S Blackstone Ave
- 8041 S Blackstone Ave
- 8005 S Blackstone Ave
- 7839 S Kimbark Ave
- 1129 E 81st St
- 8106 S Harper Ave
- 8227 S Avalon Ave
- 7930 S Anthony Ave
- 7948 S Anthony Ave
- 8138 S Harper Ave
- 8250 S Kenwood Ave
- 8235 S Woodlawn Ave
- 7521 S Kimbark Ave
- 1059 E 80th St
- 8200 S Harper Ave
- 8012 S Kenwood Ave
- 8010 S Kenwood Ave
- 8018 S Kenwood Ave
- 8006 S Kenwood Ave
- 8022 S Kenwood Ave
- 8004 S Kenwood Ave
- 8000 S Kenwood Ave
- 8024 S Kenwood Ave
- 8013 S Kimbark Ave
- 8017 S Kimbark Ave
- 8011 S Kimbark Ave
- 8028 S Kenwood Ave
- 8007 S Kimbark Ave
- 8019 S Kimbark Ave
- 8005 S Kimbark Ave
- 8023 S Kimbark Ave
- 8030 S Kenwood Ave
- 8001 S Kimbark Ave
- 8027 S Kimbark Ave
- 7958 S Kenwood Ave