Estimated Value: $166,000 - $341,000
5
Beds
2
Baths
1,600
Sq Ft
$156/Sq Ft
Est. Value
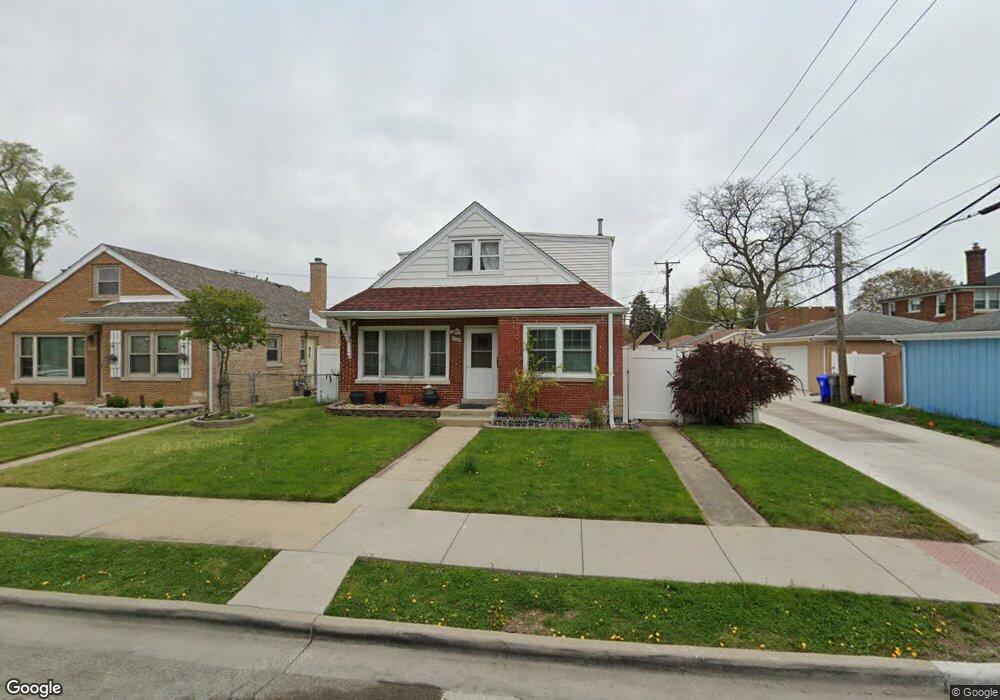
About This Home
This home is located at 8018 42nd St, Lyons, IL 60534 and is currently estimated at $250,123, approximately $156 per square foot. 8018 42nd St is a home located in Cook County with nearby schools including Costello Elementary School, George Washington Middle School, and J. Sterling Morton High School West.
Ownership History
Date
Name
Owned For
Owner Type
Purchase Details
Closed on
Jul 30, 2017
Sold by
Diaz Rosalia
Bought by
Cabrera Rodriguez Nydia Mayela and Rodriguez Nydia O
Current Estimated Value
Home Financials for this Owner
Home Financials are based on the most recent Mortgage that was taken out on this home.
Original Mortgage
$143,378
Outstanding Balance
$123,278
Interest Rate
5.5%
Mortgage Type
FHA
Estimated Equity
$126,845
Purchase Details
Closed on
Dec 19, 2002
Sold by
Klementzos Angelo J
Bought by
Diaz Rosalia
Home Financials for this Owner
Home Financials are based on the most recent Mortgage that was taken out on this home.
Original Mortgage
$138,750
Interest Rate
6.01%
Purchase Details
Closed on
Apr 28, 1999
Sold by
Gachev George and Gachev Kathy
Bought by
Klementzos Angelo J
Home Financials for this Owner
Home Financials are based on the most recent Mortgage that was taken out on this home.
Original Mortgage
$130,150
Interest Rate
8.25%
Create a Home Valuation Report for This Property
The Home Valuation Report is an in-depth analysis detailing your home's value as well as a comparison with similar homes in the area
Home Values in the Area
Average Home Value in this Area
Purchase History
| Date | Buyer | Sale Price | Title Company |
|---|---|---|---|
| Cabrera Rodriguez Nydia Mayela | $148,500 | Baird & Warner Title Service | |
| Diaz Rosalia | $185,000 | Multiple | |
| Klementzos Angelo J | $137,000 | Professional National Title |
Source: Public Records
Mortgage History
| Date | Status | Borrower | Loan Amount |
|---|---|---|---|
| Open | Cabrera Rodriguez Nydia Mayela | $143,378 | |
| Previous Owner | Diaz Rosalia | $138,750 | |
| Previous Owner | Klementzos Angelo J | $130,150 |
Source: Public Records
Tax History
| Year | Tax Paid | Tax Assessment Tax Assessment Total Assessment is a certain percentage of the fair market value that is determined by local assessors to be the total taxable value of land and additions on the property. | Land | Improvement |
|---|---|---|---|---|
| 2025 | $3,639 | $27,000 | $2,947 | $24,053 |
| 2024 | $3,639 | $27,000 | $2,947 | $24,053 |
| 2023 | $3,477 | $18,000 | $2,947 | $15,053 |
| 2022 | $3,477 | $15,729 | $2,563 | $13,166 |
| 2021 | $3,352 | $15,728 | $2,562 | $13,166 |
| 2020 | $3,510 | $15,728 | $2,562 | $13,166 |
| 2019 | $3,282 | $14,696 | $2,306 | $12,390 |
| 2018 | $3,205 | $14,696 | $2,306 | $12,390 |
| 2017 | $5,325 | $14,696 | $2,306 | $12,390 |
| 2016 | $3,305 | $13,416 | $2,050 | $11,366 |
| 2015 | $3,396 | $13,416 | $2,050 | $11,366 |
| 2014 | $3,312 | $13,416 | $2,050 | $11,366 |
| 2013 | $3,524 | $14,858 | $2,050 | $12,808 |
Source: Public Records
Map
Nearby Homes
- 4252 Prescott Ave
- 4147 Amelia Ave
- 7700 Joliet Rd
- 4448 Lawndale Ave
- 4223 Elm Ave
- 7911 45th St
- 4350 Elm Ave
- 4313 Elm Ave
- 4446 Gage Ave
- 336 Fairbank Rd
- 8332 44th Place
- 4539 Clyde Ave
- 201 Scottswood Rd
- 8667 Plainfield Rd
- 8553 Ogden Ave Unit 1
- 4053 Rose Ave
- 8625 43rd St
- 20 Forbes Rd
- 4524 1st Ave
- 176 Riverside Rd
Your Personal Tour Guide
Ask me questions while you tour the home.