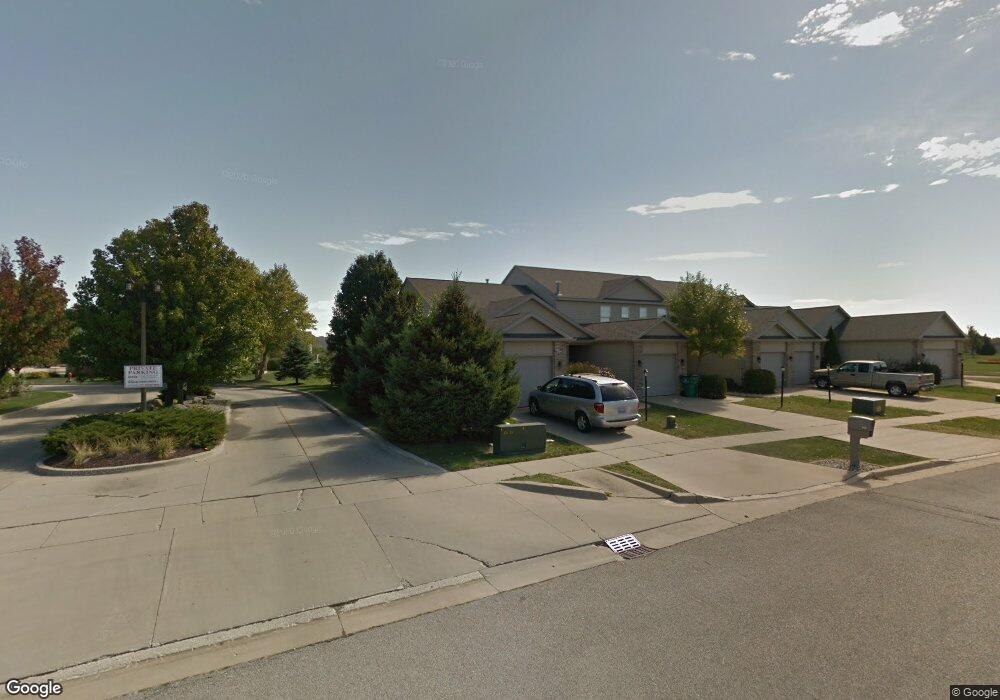
802 Cobblefield Rd Champaign, IL 61822
Estimated Value: $183,562 - $334,000
--
Bed
--
Bath
--
Sq Ft
3,528
Sq Ft Lot
About This Home
This home is located at 802 Cobblefield Rd, Champaign, IL 61822 and is currently estimated at $226,641. 802 Cobblefield Rd is a home located in Champaign County with nearby schools including Centennial High School, Countryside School, and Swann Special Care Center-Elem/Secondary School.
Ownership History
Date
Name
Owned For
Owner Type
Purchase Details
Closed on
Sep 9, 2013
Sold by
Johnson Eric L
Bought by
Schultz Robert A and Schultz Nancy M
Current Estimated Value
Home Financials for this Owner
Home Financials are based on the most recent Mortgage that was taken out on this home.
Original Mortgage
$122,617
Outstanding Balance
$91,392
Interest Rate
4.37%
Mortgage Type
VA
Estimated Equity
$135,249
Purchase Details
Closed on
May 28, 2009
Sold by
Hemming Wayne J and Hemming Ann J
Bought by
Johnson Eric L
Home Financials for this Owner
Home Financials are based on the most recent Mortgage that was taken out on this home.
Original Mortgage
$95,600
Interest Rate
4.84%
Mortgage Type
Purchase Money Mortgage
Purchase Details
Closed on
Feb 21, 2006
Sold by
Breckenridge Contractors Llc
Bought by
Hemming Wayne J and Hemming Ann J
Home Financials for this Owner
Home Financials are based on the most recent Mortgage that was taken out on this home.
Original Mortgage
$113,598
Interest Rate
6.2%
Mortgage Type
Fannie Mae Freddie Mac
Create a Home Valuation Report for This Property
The Home Valuation Report is an in-depth analysis detailing your home's value as well as a comparison with similar homes in the area
Home Values in the Area
Average Home Value in this Area
Purchase History
| Date | Buyer | Sale Price | Title Company |
|---|---|---|---|
| Schultz Robert A | $119,000 | None Available | |
| Johnson Eric L | $119,500 | None Available | |
| Hemming Wayne J | $126,500 | None Available |
Source: Public Records
Mortgage History
| Date | Status | Borrower | Loan Amount |
|---|---|---|---|
| Open | Schultz Robert A | $122,617 | |
| Previous Owner | Johnson Eric L | $95,600 | |
| Previous Owner | Hemming Wayne J | $113,598 |
Source: Public Records
Tax History Compared to Growth
Tax History
| Year | Tax Paid | Tax Assessment Tax Assessment Total Assessment is a certain percentage of the fair market value that is determined by local assessors to be the total taxable value of land and additions on the property. | Land | Improvement |
|---|---|---|---|---|
| 2024 | $3,178 | $50,770 | $12,980 | $37,790 |
| 2023 | $3,178 | $46,240 | $11,820 | $34,420 |
| 2022 | $2,834 | $42,650 | $10,900 | $31,750 |
| 2021 | $2,746 | $41,820 | $10,690 | $31,130 |
| 2020 | $2,751 | $41,000 | $10,480 | $30,520 |
| 2019 | $2,641 | $40,150 | $10,260 | $29,890 |
| 2018 | $2,566 | $39,520 | $10,100 | $29,420 |
| 2017 | $2,577 | $39,520 | $10,100 | $29,420 |
| 2016 | $2,291 | $38,700 | $9,890 | $28,810 |
| 2015 | $2,292 | $38,010 | $9,710 | $28,300 |
| 2014 | $2,272 | $38,010 | $9,710 | $28,300 |
| 2013 | $2,669 | $38,010 | $9,710 | $28,300 |
Source: Public Records
Map
Nearby Homes
- 3907 Aberdeen Dr
- 803 Prestwick Point
- 1012 Waters Edge Rd
- 4103 Crail Rd
- 1201 Waters Edge Rd
- 4007 Turnberry Dr
- 1505 Casselbury Ln
- 1512 Cobblefield Rd
- 3601 Brook Ridge Cir
- 710 Dogwood Dr
- 1632 Cobblefield Rd Unit 3
- 708 S Duncan Rd
- 1801 Cobblefield Ct
- 4203 Curtis Meadow Dr
- 4008 Pinecrest Dr
- 1406 S Duncan Rd
- 1504 Wyndemere Point Dr
- 634 Sedgegrass Dr
- 1211 English Oak Dr
- 4812 Oakdale Dr
- 804 Cobblefield Rd
- 806 Cobblefield Rd
- 808 Cobblefield Rd
- 3848 Balmoral Dr
- 810 Cobblefield Rd
- 3856 Thornhill Cir Unit 3856
- 3856 Thornhill Cir Unit 3856
- 3846 Balmoral Dr
- 3844 Balmoral Dr
- 3858 Thornhill Cir Unit 3858
- 3860 Thornhill Cir Unit 3860
- 3901 Inverness Rd
- 3842 Balmoral Dr
- 3769 Thornhill Cir Unit 3769
- 3767 Thornhill Cir Unit 3767
- 3852 Thornhill Cir Unit 3852
- 3840 Balmoral Dr
- 3854 Thornhill Cir Unit 3854
- 3854 Thornhill Cir Unit 3854