Estimated Value: $122,000 - $163,000
5
Beds
1
Bath
1,864
Sq Ft
$75/Sq Ft
Est. Value
About This Home
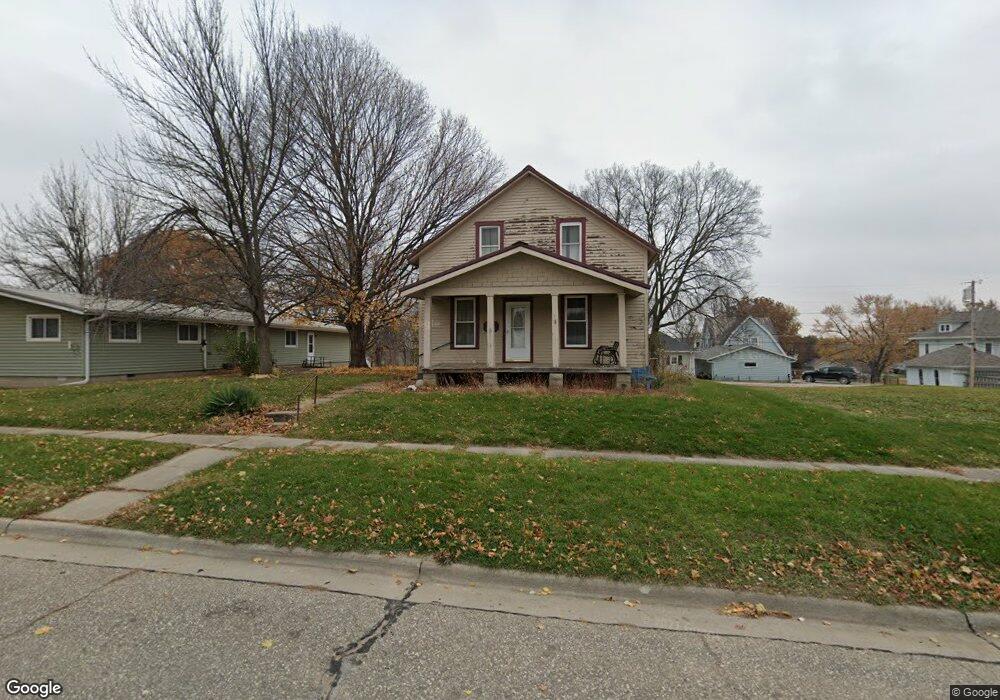
This home is located at 802 Elm St, Traer, IA 50675 and is currently estimated at $139,700, approximately $74 per square foot. 802 Elm St is a home with nearby schools including North Tama Elementary School and North Tama High School.
Ownership History
Date
Name
Owned For
Owner Type
Purchase Details
Closed on
Jan 4, 2022
Sold by
Fuller Matthew C
Bought by
Catherwood Aaron E
Current Estimated Value
Home Financials for this Owner
Home Financials are based on the most recent Mortgage that was taken out on this home.
Original Mortgage
$8,750
Outstanding Balance
$6,738
Interest Rate
2.43%
Estimated Equity
$132,963
Purchase Details
Closed on
Aug 22, 2005
Sold by
Mckenna Gary L and Mckenna Teresa A
Bought by
Fuller Matthew C
Home Financials for this Owner
Home Financials are based on the most recent Mortgage that was taken out on this home.
Original Mortgage
$78,300
Interest Rate
5.8%
Mortgage Type
New Conventional
Create a Home Valuation Report for This Property
The Home Valuation Report is an in-depth analysis detailing your home's value as well as a comparison with similar homes in the area
Home Values in the Area
Average Home Value in this Area
Purchase History
| Date | Buyer | Sale Price | Title Company |
|---|---|---|---|
| Catherwood Aaron E | $87,500 | None Listed On Document | |
| Fuller Matthew C | $87,000 | None Available |
Source: Public Records
Mortgage History
| Date | Status | Borrower | Loan Amount |
|---|---|---|---|
| Open | Catherwood Aaron E | $8,750 | |
| Open | Catherwood Aaron E | $78,750 | |
| Previous Owner | Fuller Matthew C | $78,300 |
Source: Public Records
Tax History Compared to Growth
Tax History
| Year | Tax Paid | Tax Assessment Tax Assessment Total Assessment is a certain percentage of the fair market value that is determined by local assessors to be the total taxable value of land and additions on the property. | Land | Improvement |
|---|---|---|---|---|
| 2024 | $1,838 | $92,450 | $11,040 | $81,410 |
| 2023 | $1,704 | $92,450 | $11,040 | $81,410 |
| 2022 | $1,730 | $85,610 | $11,040 | $74,570 |
| 2021 | $1,686 | $93,490 | $10,760 | $82,730 |
| 2020 | $14 | $87,100 | $10,760 | $76,340 |
| 2019 | $1,438 | $72,630 | $0 | $0 |
| 2018 | $1,384 | $72,630 | $0 | $0 |
| 2017 | $1,384 | $72,630 | $0 | $0 |
| 2016 | $1,298 | $72,630 | $8,280 | $64,350 |
| 2015 | $1,284 | $72,630 | $8,280 | $64,350 |
| 2014 | $1,284 | $73,820 | $11,040 | $62,780 |
Source: Public Records
Map
Nearby Homes