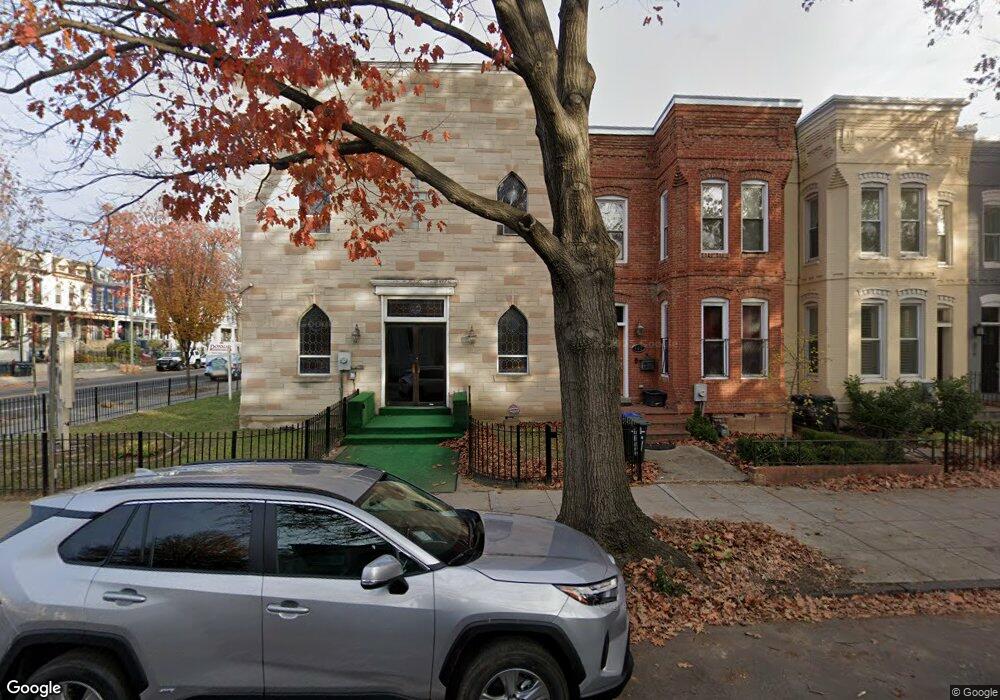
802 I St NE Washington, DC 20002
Atlas District NeighborhoodEstimated Value: $995,000 - $1,194,000
3
Beds
3
Baths
2,344
Sq Ft
$474/Sq Ft
Est. Value
About This Home
This home is located at 802 I St NE, Washington, DC 20002 and is currently estimated at $1,112,152, approximately $474 per square foot. 802 I St NE is a home located in District of Columbia with nearby schools including J.O. Wilson Elementary School, Stuart-Hobson Middle School, and Eastern High School.
Ownership History
Date
Name
Owned For
Owner Type
Purchase Details
Closed on
Mar 25, 2010
Sold by
Lamberton Jack Clark and Lamberton Jason Carl
Bought by
Lamberton Judith Lynn
Current Estimated Value
Purchase Details
Closed on
Mar 16, 2004
Sold by
Thompson Matthew A
Bought by
Lamberton Jack Clark
Home Financials for this Owner
Home Financials are based on the most recent Mortgage that was taken out on this home.
Original Mortgage
$333,700
Interest Rate
5.71%
Mortgage Type
New Conventional
Purchase Details
Closed on
Aug 14, 2003
Sold by
Park Place Iv Llc
Bought by
Thompson Matthew
Home Financials for this Owner
Home Financials are based on the most recent Mortgage that was taken out on this home.
Original Mortgage
$332,500
Interest Rate
5.46%
Mortgage Type
New Conventional
Purchase Details
Closed on
Sep 28, 2002
Sold by
Speed Bernadette
Bought by
Shrader Steve
Create a Home Valuation Report for This Property
The Home Valuation Report is an in-depth analysis detailing your home's value as well as a comparison with similar homes in the area
Home Values in the Area
Average Home Value in this Area
Purchase History
| Date | Buyer | Sale Price | Title Company |
|---|---|---|---|
| Lamberton Judith Lynn | -- | -- | |
| Lamberton Jack Clark | $442,000 | -- | |
| Thompson Matthew | $205,000 | -- | |
| Shrader Steve | $81,500 | -- |
Source: Public Records
Mortgage History
| Date | Status | Borrower | Loan Amount |
|---|---|---|---|
| Previous Owner | Lamberton Jack Clark | $333,700 | |
| Previous Owner | Thompson Matthew | $332,500 |
Source: Public Records
Tax History Compared to Growth
Tax History
| Year | Tax Paid | Tax Assessment Tax Assessment Total Assessment is a certain percentage of the fair market value that is determined by local assessors to be the total taxable value of land and additions on the property. | Land | Improvement |
|---|---|---|---|---|
| 2024 | $9,783 | $1,150,920 | $558,640 | $592,280 |
| 2023 | $9,450 | $1,111,740 | $550,640 | $561,100 |
| 2022 | $5,664 | $1,078,800 | $504,220 | $574,580 |
| 2021 | $5,167 | $1,036,640 | $499,230 | $537,410 |
| 2020 | $4,703 | $996,990 | $469,210 | $527,780 |
| 2019 | $4,282 | $950,870 | $442,550 | $508,320 |
| 2018 | $3,904 | $905,040 | $0 | $0 |
| 2017 | $3,556 | $873,820 | $0 | $0 |
| 2016 | $3,239 | $796,760 | $0 | $0 |
| 2015 | $2,947 | $691,120 | $0 | $0 |
| 2014 | $2,688 | $630,800 | $0 | $0 |
Source: Public Records
Map
Nearby Homes
- 910 8th St NE
- 922 8th St NE
- 910 9th St NE Unit 1
- 802 K St NE
- 903 K St NE
- 626 I St NE
- 646 H St NE Unit 305
- 646 H St NE Unit 405
- 646 H St NE Unit 406
- 833 L St NE
- 607 K St NE
- 1010 I St NE
- 1014 10th St NE Unit 1
- 1004 K St NE
- 1019 10th St NE
- 1009A I St NE
- 640 L St NE
- 1121 8th St NE
- 1129 8th St NE
- 1027 6th St NE