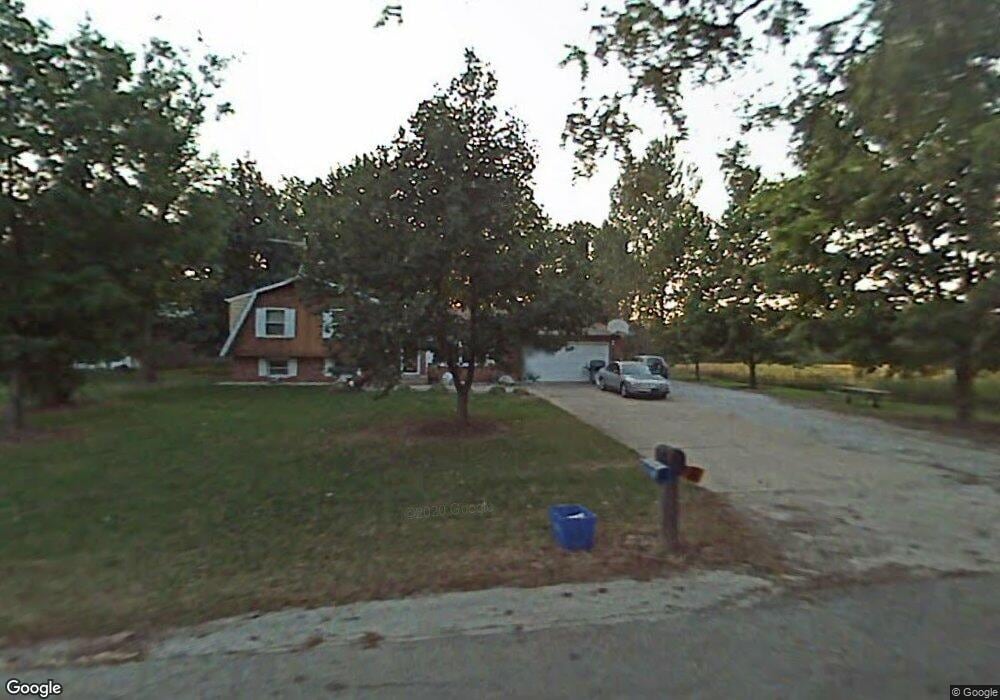
802 N 875 E Mill Creek, IN 46365
Estimated Value: $241,046 - $339,000
4
Beds
2
Baths
1,800
Sq Ft
$171/Sq Ft
Est. Value
About This Home
This home is located at 802 N 875 E, Mill Creek, IN 46365 and is currently estimated at $308,012, approximately $171 per square foot. 802 N 875 E is a home located in LaPorte County with nearby schools including New Prairie High School.
Ownership History
Date
Name
Owned For
Owner Type
Purchase Details
Closed on
Mar 7, 2006
Sold by
Bernth Tina R
Bought by
Bernth Dennis C
Current Estimated Value
Home Financials for this Owner
Home Financials are based on the most recent Mortgage that was taken out on this home.
Original Mortgage
$95,500
Outstanding Balance
$54,608
Interest Rate
6.37%
Mortgage Type
Fannie Mae Freddie Mac
Estimated Equity
$253,404
Create a Home Valuation Report for This Property
The Home Valuation Report is an in-depth analysis detailing your home's value as well as a comparison with similar homes in the area
Home Values in the Area
Average Home Value in this Area
Purchase History
| Date | Buyer | Sale Price | Title Company |
|---|---|---|---|
| Bernth Dennis C | -- | None Available |
Source: Public Records
Mortgage History
| Date | Status | Borrower | Loan Amount |
|---|---|---|---|
| Open | Bernth Dennis C | $95,500 |
Source: Public Records
Tax History Compared to Growth
Tax History
| Year | Tax Paid | Tax Assessment Tax Assessment Total Assessment is a certain percentage of the fair market value that is determined by local assessors to be the total taxable value of land and additions on the property. | Land | Improvement |
|---|---|---|---|---|
| 2024 | $1,453 | $159,100 | $36,500 | $122,600 |
| 2022 | $1,639 | $163,000 | $36,500 | $126,500 |
| 2021 | $1,664 | $154,100 | $36,500 | $117,600 |
| 2020 | $1,721 | $154,100 | $36,500 | $117,600 |
| 2019 | $1,719 | $155,600 | $36,500 | $119,100 |
| 2018 | $1,370 | $138,000 | $27,500 | $110,500 |
| 2017 | $1,227 | $126,900 | $25,300 | $101,600 |
| 2016 | $1,385 | $130,800 | $25,300 | $105,500 |
| 2014 | $1,586 | $162,300 | $18,400 | $143,900 |
Source: Public Records
Map
Nearby Homes
- 829 N 1000 E
- 1672 S 875 E
- 345 S 600 E
- 4271 E 50 N
- 7428 E 400 N
- 212 Lakeside Dr
- US 6 East Dr
- 67 Acres E 300 N
- 30750 Inwood Rd
- 58521 Strawberry Rd
- 0 S Longshore Dr
- 0 Cherry Dr
- 30390 Inwood Rd
- 8196 E Walnut Ridge
- 315 Holly Dr
- 7674 Potato Hole Ct
- The Gipper Plan at Stone Oak Estates
- The Sorin Plan at Stone Oak Estates
- The Leahy Plan at Stone Oak Estates
- The Ara Plan at Stone Oak Estates