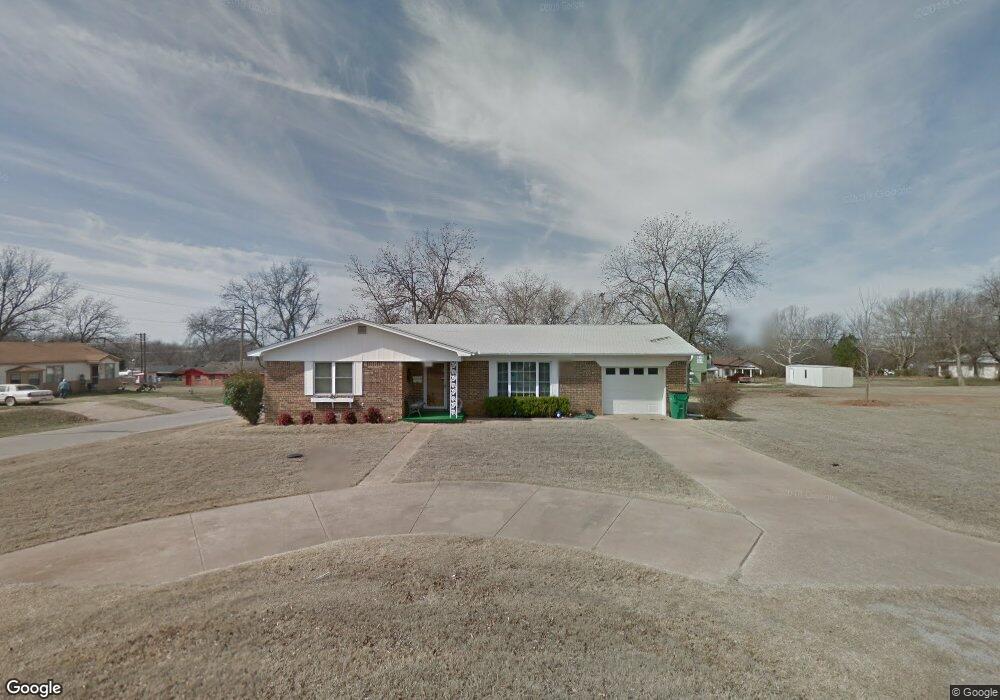
802 N Pine St Waurika, OK 73573
Estimated Value: $98,000 - $137,000
3
Beds
2
Baths
1,906
Sq Ft
$60/Sq Ft
Est. Value
About This Home
This home is located at 802 N Pine St, Waurika, OK 73573 and is currently estimated at $115,181, approximately $60 per square foot. 802 N Pine St is a home located in Jefferson County with nearby schools including Waurika Elementary School, Waurika Middle School, and Waurika High School.
Ownership History
Date
Name
Owned For
Owner Type
Purchase Details
Closed on
Aug 19, 2019
Sold by
Stanley O P 1993 Trust
Bought by
Gomez Jaime and Gomez Regina
Current Estimated Value
Home Financials for this Owner
Home Financials are based on the most recent Mortgage that was taken out on this home.
Original Mortgage
$40,000
Outstanding Balance
$10,330
Interest Rate
3.7%
Mortgage Type
Construction
Estimated Equity
$104,851
Purchase Details
Closed on
Oct 5, 2012
Sold by
Stanley Opal
Bought by
Stanley Opal P 1993 Rev T
Purchase Details
Closed on
Feb 8, 1994
Sold by
Stanley Bruce
Bought by
Stanley Opal P '93 Rev Tr
Create a Home Valuation Report for This Property
The Home Valuation Report is an in-depth analysis detailing your home's value as well as a comparison with similar homes in the area
Home Values in the Area
Average Home Value in this Area
Purchase History
| Date | Buyer | Sale Price | Title Company |
|---|---|---|---|
| Gomez Jaime | $62,000 | -- | |
| Stanley Opal P 1993 Rev T | -- | -- | |
| Stanley Opal P '93 Rev Tr | -- | -- |
Source: Public Records
Mortgage History
| Date | Status | Borrower | Loan Amount |
|---|---|---|---|
| Open | Gomez Jaime | $40,000 |
Source: Public Records
Tax History Compared to Growth
Tax History
| Year | Tax Paid | Tax Assessment Tax Assessment Total Assessment is a certain percentage of the fair market value that is determined by local assessors to be the total taxable value of land and additions on the property. | Land | Improvement |
|---|---|---|---|---|
| 2024 | $554 | $5,870 | $274 | $5,596 |
| 2023 | $554 | $5,870 | $274 | $5,596 |
| 2022 | $556 | $5,870 | $274 | $5,596 |
| 2021 | $574 | $5,870 | $274 | $5,596 |
| 2020 | $668 | $6,900 | $138 | $6,762 |
| 2019 | $470 | $5,968 | $138 | $5,830 |
| 2018 | $429 | $5,794 | $138 | $5,656 |
| 2017 | $453 | $5,939 | $138 | $5,801 |
| 2016 | $445 | $5,981 | $180 | $5,801 |
| 2015 | $45 | $5,806 | $177 | $5,629 |
| 2014 | $423 | $5,637 | $172 | $5,465 |
Source: Public Records
Map
Nearby Homes
- 413 413 E Harper
- 617
- 112 E Iowa Ave
- 1005 N Meridian St
- 127 127 E Missouri
- 1030 1030 N Ash
- 705 NE 8th St
- 1004 1004 Magnolia
- 1202 1202 N Pine
- 114 E G Ave
- 320 SW 1st St
- 7071 7071 State Hwy 5
- 6752 Highway 81
- 0 Oklahoma 5
- 9494 N 2780 Rd
- 6659 6659 E 1940 Rd
- 7920 N2760 Rd
- 311 Parker St
- N2740 Road
- 186233 N 2740 Rd