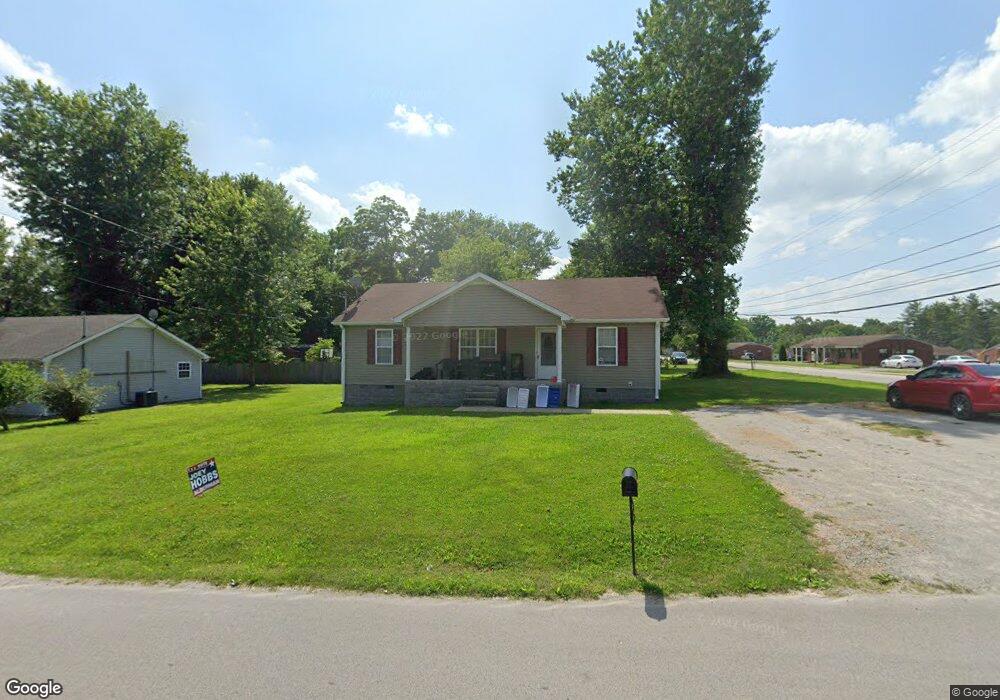
802 Oak St Manchester, TN 37355
Estimated Value: $194,771 - $232,000
--
Bed
2
Baths
1,144
Sq Ft
$185/Sq Ft
Est. Value
About This Home
This home is located at 802 Oak St, Manchester, TN 37355 and is currently estimated at $211,943, approximately $185 per square foot. 802 Oak St is a home located in Coffee County with nearby schools including Westwood Middle School and Temple Baptist Christian School.
Ownership History
Date
Name
Owned For
Owner Type
Purchase Details
Closed on
Jun 27, 2008
Sold by
Char El Apartment Realty C
Bought by
Hale William L
Current Estimated Value
Purchase Details
Closed on
Jun 29, 2007
Sold by
Adams Dewey
Bought by
Char - El Apartment & Realty
Purchase Details
Closed on
Jul 28, 2006
Sold by
Lowe David
Bought by
Adams Dewey
Home Financials for this Owner
Home Financials are based on the most recent Mortgage that was taken out on this home.
Original Mortgage
$30,000
Interest Rate
6.68%
Purchase Details
Closed on
Jul 3, 1997
Sold by
Townsend Sherrill Mary
Bought by
Banks Lee and Banks Polly
Create a Home Valuation Report for This Property
The Home Valuation Report is an in-depth analysis detailing your home's value as well as a comparison with similar homes in the area
Home Values in the Area
Average Home Value in this Area
Purchase History
| Date | Buyer | Sale Price | Title Company |
|---|---|---|---|
| Hale William L | $84,000 | -- | |
| Char - El Apartment & Realty | $165,000 | -- | |
| Adams Dewey | $34,000 | -- | |
| Banks Lee | $17,000 | -- |
Source: Public Records
Mortgage History
| Date | Status | Borrower | Loan Amount |
|---|---|---|---|
| Previous Owner | Banks Lee | $30,000 |
Source: Public Records
Tax History Compared to Growth
Tax History
| Year | Tax Paid | Tax Assessment Tax Assessment Total Assessment is a certain percentage of the fair market value that is determined by local assessors to be the total taxable value of land and additions on the property. | Land | Improvement |
|---|---|---|---|---|
| 2024 | $1,290 | $30,600 | $2,550 | $28,050 |
| 2023 | $1,290 | $30,600 | $0 | $0 |
| 2022 | $1,111 | $30,600 | $2,550 | $28,050 |
| 2021 | $1,057 | $23,075 | $1,750 | $21,325 |
| 2020 | $1,057 | $23,075 | $1,750 | $21,325 |
| 2019 | $1,057 | $23,075 | $1,750 | $21,325 |
| 2018 | $1,057 | $23,075 | $1,750 | $21,325 |
| 2017 | $1,081 | $20,600 | $1,750 | $18,850 |
| 2016 | $1,081 | $20,600 | $1,750 | $18,850 |
| 2015 | $1,081 | $20,600 | $1,750 | $18,850 |
| 2014 | $1,081 | $20,602 | $0 | $0 |
Source: Public Records
Map
Nearby Homes