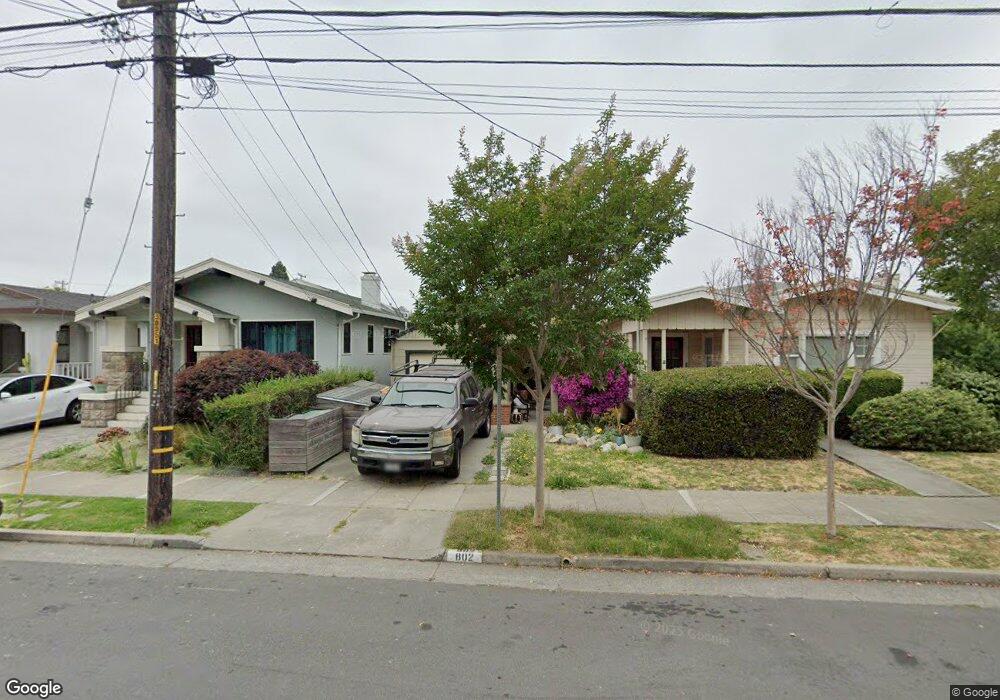
802 Pomona Ave Albany, CA 94706
Estimated Value: $1,003,000 - $1,191,000
2
Beds
1
Bath
916
Sq Ft
$1,194/Sq Ft
Est. Value
About This Home
This home is located at 802 Pomona Ave, Albany, CA 94706 and is currently estimated at $1,093,821, approximately $1,194 per square foot. 802 Pomona Ave is a home located in Alameda County with nearby schools including Albany Middle School, Albany High School, and Tehiyah Day School.
Ownership History
Date
Name
Owned For
Owner Type
Purchase Details
Closed on
Nov 27, 2021
Sold by
Kusaba 1996 Survivors Trust
Bought by
Yamamoto Kelly and Yamamoto Christopher
Current Estimated Value
Purchase Details
Closed on
Oct 14, 2021
Sold by
Margaret Kusaba
Bought by
Kusaba 1996 Trust
Purchase Details
Closed on
Oct 17, 2019
Sold by
Kusaba Margaret I
Bought by
Kusaba Margaret I and Kusaba 1996 Exemption Trust
Purchase Details
Closed on
Jan 11, 2018
Sold by
Kusaba Margaret I and Kusaba 1996 Exemption Trust
Bought by
Kusaba Margaret I and Kusaba 1996 Exemption Trust
Purchase Details
Closed on
Oct 23, 2017
Sold by
Kusaba Margaret I and Kusaba 1996 Exemption Trust
Bought by
Kusaba Margaret I and Kusaba 1996 Survivors Trust
Purchase Details
Closed on
Dec 21, 1998
Sold by
Kusaba Margaret
Bought by
Kusaba Margaret I and Kusaba 1996 Exemption Trust
Purchase Details
Closed on
Jun 18, 1996
Sold by
Kusaba George and Kusaba Margaret
Bought by
Kusaba George and Kusaba Margaret I
Create a Home Valuation Report for This Property
The Home Valuation Report is an in-depth analysis detailing your home's value as well as a comparison with similar homes in the area
Home Values in the Area
Average Home Value in this Area
Purchase History
| Date | Buyer | Sale Price | Title Company |
|---|---|---|---|
| Yamamoto Kelly | -- | Kelley & Farren Llp | |
| Kusaba 1996 Trust | -- | -- | |
| Kusaba Margaret I | -- | None Available | |
| Kusaba Margaret I | -- | None Available | |
| Kusaba Margaret I | -- | None Available | |
| Kusaba Margaret I | -- | None Available | |
| Kusaba Margaret I | -- | -- | |
| Kusaba George | -- | -- |
Source: Public Records
Tax History Compared to Growth
Tax History
| Year | Tax Paid | Tax Assessment Tax Assessment Total Assessment is a certain percentage of the fair market value that is determined by local assessors to be the total taxable value of land and additions on the property. | Land | Improvement |
|---|---|---|---|---|
| 2025 | $17,789 | $917,937 | $275,381 | $642,556 |
| 2024 | $17,789 | $1,092,420 | $327,726 | $764,694 |
| 2023 | $17,524 | $1,071,000 | $321,300 | $749,700 |
| 2022 | $4,345 | $1,050,000 | $315,000 | $735,000 |
| 2021 | $4,254 | $121,662 | $77,266 | $44,396 |
| 2020 | $4,091 | $120,415 | $76,474 | $43,941 |
| 2019 | $3,994 | $118,053 | $74,974 | $43,079 |
| 2018 | $3,894 | $115,738 | $73,504 | $42,234 |
| 2017 | $3,794 | $113,469 | $72,063 | $41,406 |
| 2016 | $3,627 | $111,244 | $70,650 | $40,594 |
| 2015 | $3,489 | $109,574 | $69,589 | $39,985 |
| 2014 | $3,367 | $107,428 | $68,226 | $39,202 |
Source: Public Records
Map
Nearby Homes
- 720 Key Route Blvd
- 840 Key Route Blvd
- 606 Masonic Ave
- 609 San Carlos Ave
- 848 Stannage Ave Unit 11
- 625 Stannage Ave
- 1120 Garfield Ave
- 417 Evelyn Ave Unit 205
- 1126 Brighton Ave
- 518 Kains Ave Unit 103
- 545 Colusa Ave
- 1054 Masonic Ave
- 951 Madison St
- 704 Madison St
- 1038 Cornell Ave
- 1046 Santa fe Ave
- 935 Hillside Ave
- 1050 Kains Ave Unit 3(B1)
- 800 Pomona Ave
- 804 Pomona Ave
- 808 Pomona Ave
- 801 Key Route Blvd
- 805 Key Route Blvd
- 816 Pomona Ave
- 807 Key Route Blvd
- 1317 Washington Ave
- 809 Key Route Blvd
- 818 Pomona Ave
- 811 Key Route Blvd
- 805 Pomona Ave
- 1315 Washington Ave
- 744 Pomona Ave
- 803 Pomona Ave
- 811 Pomona Ave
- 1330 Washington Ave
- 813 Pomona Ave
- 813 Key Route Blvd
- 739 Key Route Blvd