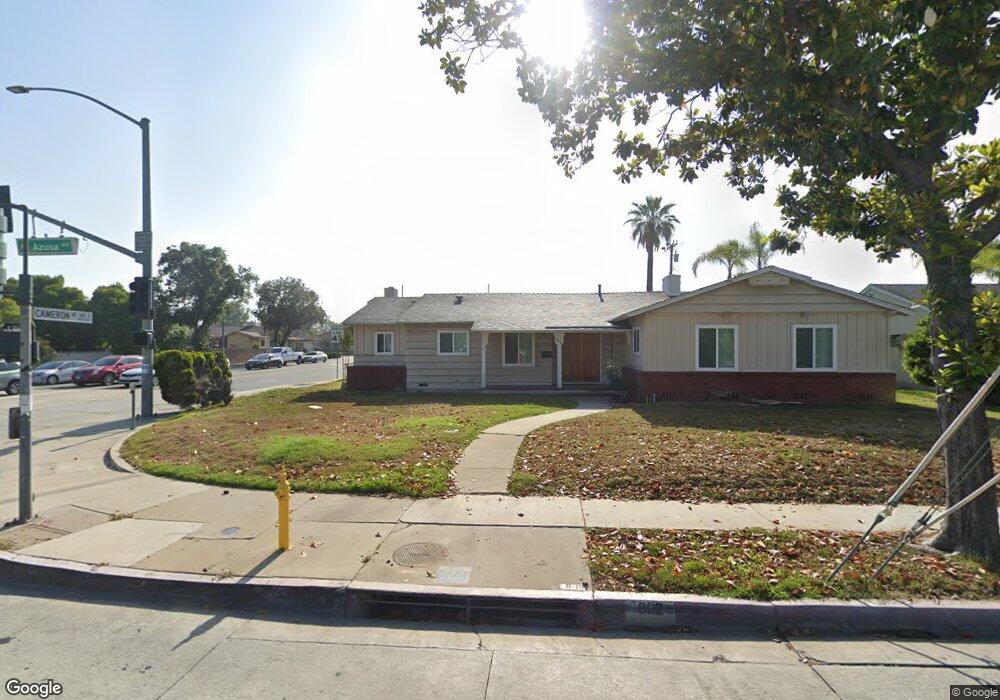
802 S Azusa Ave West Covina, CA 91791
South Hills NeighborhoodEstimated Value: $916,000 - $990,992
3
Beds
2
Baths
1,896
Sq Ft
$504/Sq Ft
Est. Value
About This Home
This home is located at 802 S Azusa Ave, West Covina, CA 91791 and is currently estimated at $955,248, approximately $503 per square foot. 802 S Azusa Ave is a home located in Los Angeles County with nearby schools including Vine Elementary School, Hollencrest Middle School, and West Covina High School.
Ownership History
Date
Name
Owned For
Owner Type
Purchase Details
Closed on
Aug 12, 2024
Sold by
Hang Teresa Luc
Bought by
Teresa Hang Family Trust and Hang
Current Estimated Value
Purchase Details
Closed on
Apr 26, 2024
Sold by
Hang Max and Hang Teresa Luc
Bought by
Hang Teresa Luc
Home Financials for this Owner
Home Financials are based on the most recent Mortgage that was taken out on this home.
Original Mortgage
$150,000
Interest Rate
6.87%
Mortgage Type
New Conventional
Purchase Details
Closed on
Oct 25, 2023
Sold by
Hang Max and Hang Vivian
Bought by
Hang Max and Hang Teresa Luc
Home Financials for this Owner
Home Financials are based on the most recent Mortgage that was taken out on this home.
Original Mortgage
$100,000
Interest Rate
7.19%
Mortgage Type
New Conventional
Purchase Details
Closed on
Jul 31, 2020
Sold by
Luc Sam
Bought by
Hang Max and Hang Vivian
Create a Home Valuation Report for This Property
The Home Valuation Report is an in-depth analysis detailing your home's value as well as a comparison with similar homes in the area
Home Values in the Area
Average Home Value in this Area
Purchase History
| Date | Buyer | Sale Price | Title Company |
|---|---|---|---|
| Teresa Hang Family Trust | -- | None Listed On Document | |
| Hang Teresa Luc | -- | Wfg National Title | |
| Hang Max | -- | Wfg National Title | |
| Hang Max | -- | Accommodation |
Source: Public Records
Mortgage History
| Date | Status | Borrower | Loan Amount |
|---|---|---|---|
| Previous Owner | Hang Teresa Luc | $150,000 | |
| Previous Owner | Hang Max | $100,000 |
Source: Public Records
Tax History Compared to Growth
Tax History
| Year | Tax Paid | Tax Assessment Tax Assessment Total Assessment is a certain percentage of the fair market value that is determined by local assessors to be the total taxable value of land and additions on the property. | Land | Improvement |
|---|---|---|---|---|
| 2025 | $8,082 | $660,278 | $432,970 | $227,308 |
| 2024 | $8,082 | $647,336 | $424,483 | $222,853 |
| 2023 | $7,597 | $634,644 | $416,160 | $218,484 |
| 2022 | $7,663 | $622,200 | $408,000 | $214,200 |
| 2021 | $7,444 | $610,000 | $400,000 | $210,000 |
| 2020 | $3,912 | $286,110 | $158,510 | $127,600 |
| 2019 | $3,796 | $280,501 | $155,402 | $125,099 |
| 2018 | $3,570 | $275,002 | $152,355 | $122,647 |
| 2016 | $3,256 | $264,326 | $146,440 | $117,886 |
| 2015 | $3,195 | $260,357 | $144,241 | $116,116 |
| 2014 | $3,181 | $255,258 | $141,416 | $113,842 |
Source: Public Records
Map
Nearby Homes
- 640 S Azusa Ave
- 1717 Cabrillo
- 1681 Aspen Village Way
- 859 S Hillward Ave
- 802 S Hollenbeck St
- 1940 E Walnut Creek Pkwy
- 401 S Cherrywood St
- 235 S Azusa Ave
- 1337 E Larkwood St
- 1300 S Fleetwell Ave
- 1306 S Cajon Ave
- 2147 E Rio Verde Dr
- 131 S Myrtlewood St
- 1536 E Norma Ave
- 1103 Novarro St
- 1623 E Francisquito Ave
- 2249 E Rio Verde Dr
- 1408 Millcreek
- 1694 Bridgeport Unit 99
- 1517 Mccabe Way
- 808 S Azusa Ave
- 803 S Cajon Ave
- 814 S Azusa Ave
- 809 S Cajon Ave
- 815 S Cajon Ave
- 747 S Cajon Ave
- 822 S Azusa Ave
- 1749 E Cameron Ave
- 823 S Cajon Ave
- 741 S Cajon Ave
- 1759 Aspen Village Way
- 802 S Cajon Ave
- 826 S Azusa Ave
- 808 S Cajon Ave
- 1771 Aspen Village Way Unit 38
- 1773 Aspen Village Way
- 1771 Aspen Village Way
- 1769 Aspen Village Way
- 1777 Aspen Village Way
- 1779 Aspen Village Way Unit 35