
Seller's Agent in 2014
Lorraine Riendeau
eXp Realty
(508) 714-9049
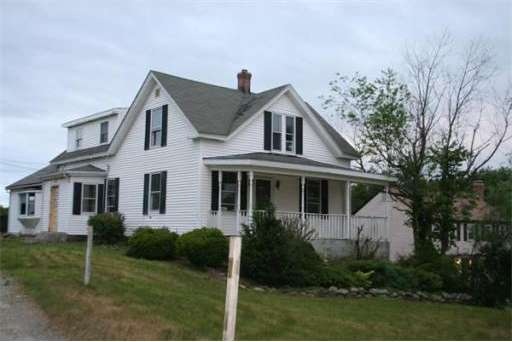
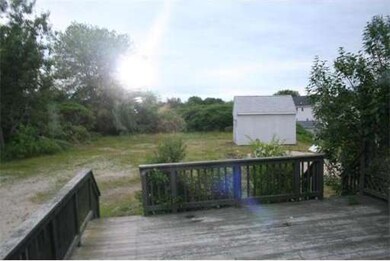
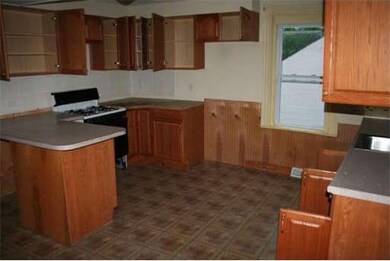
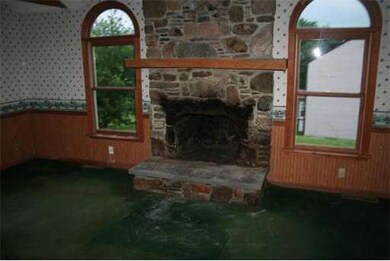
Large colonial set back off the street on 4 acres. Property has extensive freeze/water damage, but has great potential. Cash offer or rehab loans only. Lender specific prequal or proof of funds required with all offers. Deposit of at least $1000 or 3% for financed offers, 10% for cash sales req'd.
Last Buyer's Agent
Peter Butler
ERA Key Realty Services- Milf License #449500778
| Date | Type | Sale Price | Title Company |
|---|---|---|---|
| Quit Claim Deed | -- | None Available | |
| Quit Claim Deed | -- | None Available | |
| Deed | -- | -- | |
| Deed | -- | -- | |
| Personal Reps Deed | -- | -- | |
| Personal Reps Deed | -- | -- | |
| Not Resolvable | $295,000 | -- | |
| Not Resolvable | $30,000 | -- | |
| Warranty Deed | $115,000 | -- | |
| Personal Reps Deed | -- | -- | |
| Warranty Deed | $115,000 | -- |
| Date | Status | Loan Amount | Loan Type |
|---|---|---|---|
| Open | $253,000 | Stand Alone Refi Refinance Of Original Loan | |
| Previous Owner | $264,000 | Stand Alone Refi Refinance Of Original Loan | |
| Previous Owner | $280,250 | New Conventional |
| Date | Event | Price | Change | Sq Ft Price |
|---|---|---|---|---|
| 12/30/2014 12/30/14 | Sold | $295,000 | 0.0% | $152 / Sq Ft |
| 12/11/2014 12/11/14 | Pending | -- | -- | -- |
| 11/26/2014 11/26/14 | Off Market | $295,000 | -- | -- |
| 11/23/2014 11/23/14 | Price Changed | $285,000 | +3.6% | $147 / Sq Ft |
| 11/09/2014 11/09/14 | Price Changed | $275,000 | -11.3% | $142 / Sq Ft |
| 10/14/2014 10/14/14 | Price Changed | $309,900 | -3.1% | $160 / Sq Ft |
| 09/30/2014 09/30/14 | Price Changed | $319,900 | -1.5% | $165 / Sq Ft |
| 08/31/2014 08/31/14 | For Sale | $324,900 | +182.5% | $168 / Sq Ft |
| 02/13/2012 02/13/12 | Sold | $115,000 | +1.0% | $59 / Sq Ft |
| 10/14/2011 10/14/11 | Pending | -- | -- | -- |
| 09/20/2011 09/20/11 | Price Changed | $113,850 | -23.8% | $59 / Sq Ft |
| 09/01/2011 09/01/11 | Price Changed | $149,390 | -5.0% | $77 / Sq Ft |
| 08/03/2011 08/03/11 | Price Changed | $157,252 | -5.0% | $81 / Sq Ft |
| 07/19/2011 07/19/11 | Price Changed | $165,528 | -5.0% | $85 / Sq Ft |
| 06/27/2011 06/27/11 | For Sale | $174,240 | -- | $90 / Sq Ft |
| Year | Tax Paid | Tax Assessment Tax Assessment Total Assessment is a certain percentage of the fair market value that is determined by local assessors to be the total taxable value of land and additions on the property. | Land | Improvement |
|---|---|---|---|---|
| 2025 | $5,445 | $433,500 | $151,300 | $282,200 |
| 2024 | $5,207 | $404,900 | $138,200 | $266,700 |
| 2023 | $5,018 | $384,500 | $131,500 | $253,000 |
| 2022 | $4,914 | $349,000 | $111,900 | $237,100 |
| 2021 | $4,741 | $329,000 | $111,900 | $217,100 |
| 2020 | $4,566 | $321,100 | $111,900 | $209,200 |
| 2019 | $4,469 | $314,500 | $111,900 | $202,600 |
| 2018 | $4,281 | $297,100 | $112,800 | $184,300 |
| 2017 | $4,174 | $291,100 | $112,800 | $178,300 |
| 2016 | $4,011 | $280,700 | $117,400 | $163,300 |
| 2015 | $3,855 | $270,500 | $112,800 | $157,700 |
| 2014 | $3,508 | $239,300 | $109,300 | $130,000 |
Seller's Agent in 2014
Lorraine Riendeau
eXp Realty
(508) 714-9049
Buyer's Agent in 2014
Tina Haynes
Simplify Home Realty, LLC
(508) 922-6571
15 in this area
53 Total Sales
M
Seller's Agent in 2012
Mike Duggan
Bostonia Properties
(617) 738-7000
P
Buyer's Agent in 2012
Peter Butler
ERA Key Realty Services- Milf
Source: MLS Property Information Network (MLS PIN)
MLS Number: 71254086
APN: BELL-000075-000007
Disclaimer: Certain information contained herein is derived from information provided by parties other than Homes.com. All information provided is deemed reliable, but is not guaranteed to be accurate and should be independently verified.
![]() The property listing data and information, or the Images, set forth herein were provided to MLS Property Information Network, Inc. from third party sources, including sellers, lessors and public records, and were compiled by MLS Property Information Network, Inc. The property listing data and information, and the Images, are for the personal, non-commercial use of consumers having a good faith interest in purchasing or leasing listed properties of the type displayed to them and may not be used for any purpose other than to identify prospective properties which such consumers may have a good faith interest in purchasing or leasing. MLS Property Information Network, Inc. and its subscribers disclaim any and all representations and warranties as to the accuracy of the property listing data and information, or as to the accuracy of any of the Images, set forth herein.
The property listing data and information, or the Images, set forth herein were provided to MLS Property Information Network, Inc. from third party sources, including sellers, lessors and public records, and were compiled by MLS Property Information Network, Inc. The property listing data and information, and the Images, are for the personal, non-commercial use of consumers having a good faith interest in purchasing or leasing listed properties of the type displayed to them and may not be used for any purpose other than to identify prospective properties which such consumers may have a good faith interest in purchasing or leasing. MLS Property Information Network, Inc. and its subscribers disclaim any and all representations and warranties as to the accuracy of the property listing data and information, or as to the accuracy of any of the Images, set forth herein.