


802 Tremont St Unit 2 Boston, MA 02118
Lower Roxbury Neighborhood
2
Beds
1
Bath
626
Sq Ft
$173/mo
HOA Fee
Highlights
- Medical Services
- 5-minute walk to Massachusetts Ave Station (Orange Line)
- Wood Flooring
- Property is near public transit
- Rowhouse Architecture
- 3-minute walk to Carter Playground
About This Home
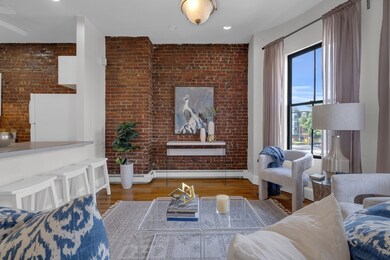
As of August 2024OPEN HOUSE CANCELLED- WE HAVE AN ACCEPTED OFFER. Enjoy this bright and cozy second floor (one above parlor) 2 bedroom in Boston's South End! Desirable open floor plan features lovely bow front living/dining room with high ceilings, exposed brick, extra large windows and hardwood floors throughout. Modern kitchen offers plenty of cabinet and counter space plus a convenient breakfast bar. The bedrooms in the back feature generous closet space, and are very quiet. Also includes in-unit laundry. Close to the MBTA, popular dining spots, Berklee/Northeastern, and easy walking distance to Symphony Hall, Copley Place, Newbury & Boylston street shopping. A great opportunity for either an investor or owner occupant!
Last Agent to Sell the Property
Keller Williams Realty Boston-Metro | Back Bay Listed on: 05/30/2024
Property Details
Home Type
- Condominium
Est. Annual Taxes
- $6,538
Year Built
- Built in 1920
HOA Fees
- $173 Monthly HOA Fees
Home Design
- Rowhouse Architecture
- Rubber Roof
Interior Spaces
- 626 Sq Ft Home
- 1-Story Property
- Wood Flooring
Kitchen
- Range
- Dishwasher
- Disposal
Bedrooms and Bathrooms
- 2 Bedrooms
- 1 Full Bathroom
Laundry
- Laundry in unit
- Dryer
- Washer
Parking
- On-Street Parking
- Open Parking
Location
- Property is near public transit
- Property is near schools
Utilities
- Window Unit Cooling System
- 1 Heating Zone
- Baseboard Heating
Listing and Financial Details
- Assessor Parcel Number W:09 P:01140 S:004,3945627
Community Details
Overview
- Association fees include water, sewer, insurance
- 4 Units
Amenities
- Medical Services
Recreation
- Park
- Bike Trail
Ownership History
Date
Name
Owned For
Owner Type
Purchase Details
Closed on
May 26, 1999
Sold by
Tremont Rt 802
Bought by
Lee Eun-Joung
Home Financials for this Owner
Home Financials are based on the most recent Mortgage that was taken out on this home.
Original Mortgage
$71,250
Interest Rate
6.82%
Mortgage Type
Purchase Money Mortgage
Similar Homes in the area
Create a Home Valuation Report for This Property
The Home Valuation Report is an in-depth analysis detailing your home's value as well as a comparison with similar homes in the area
Home Values in the Area
Average Home Value in this Area
Purchase History
| Date | Type | Sale Price | Title Company |
|---|---|---|---|
| Deed | $95,000 | -- | |
| Deed | $95,000 | -- |
Source: Public Records
Mortgage History
| Date | Status | Loan Amount | Loan Type |
|---|---|---|---|
| Open | $395,000 | Purchase Money Mortgage | |
| Closed | $395,000 | Purchase Money Mortgage | |
| Closed | $71,250 | Purchase Money Mortgage | |
| Closed | $19,000 | No Value Available |
Source: Public Records
Property History
| Date | Event | Price | Change | Sq Ft Price |
|---|---|---|---|---|
| 02/03/2025 02/03/25 | For Rent | $2,900 | 0.0% | -- |
| 10/24/2024 10/24/24 | Price Changed | $2,900 | -3.3% | $5 / Sq Ft |
| 10/03/2024 10/03/24 | For Rent | $3,000 | 0.0% | -- |
| 08/28/2024 08/28/24 | Sold | $620,000 | -0.3% | $990 / Sq Ft |
| 07/12/2024 07/12/24 | Pending | -- | -- | -- |
| 07/09/2024 07/09/24 | Price Changed | $622,000 | -5.6% | $994 / Sq Ft |
| 05/30/2024 05/30/24 | For Sale | $659,000 | 0.0% | $1,053 / Sq Ft |
| 09/01/2019 09/01/19 | Rented | $2,700 | 0.0% | -- |
| 08/26/2019 08/26/19 | For Rent | $2,700 | -3.6% | -- |
| 06/15/2017 06/15/17 | Rented | $2,800 | 0.0% | -- |
| 06/06/2017 06/06/17 | Under Contract | -- | -- | -- |
| 05/10/2017 05/10/17 | For Rent | $2,800 | -- | -- |
Source: MLS Property Information Network (MLS PIN)
Tax History Compared to Growth
Tax History
| Year | Tax Paid | Tax Assessment Tax Assessment Total Assessment is a certain percentage of the fair market value that is determined by local assessors to be the total taxable value of land and additions on the property. | Land | Improvement |
|---|---|---|---|---|
| 2025 | $7,122 | $615,000 | $0 | $615,000 |
| 2024 | $6,538 | $599,800 | $0 | $599,800 |
| 2023 | $6,313 | $587,800 | $0 | $587,800 |
| 2022 | $6,333 | $582,100 | $0 | $582,100 |
| 2021 | $6,089 | $570,700 | $0 | $570,700 |
| 2020 | $5,413 | $512,600 | $0 | $512,600 |
| 2019 | $5,245 | $497,600 | $0 | $497,600 |
| 2018 | $4,917 | $469,200 | $0 | $469,200 |
| 2017 | $4,733 | $446,900 | $0 | $446,900 |
| 2016 | $4,727 | $429,700 | $0 | $429,700 |
| 2015 | $4,688 | $387,100 | $0 | $387,100 |
| 2014 | $4,419 | $351,300 | $0 | $351,300 |
Source: Public Records
Agents Affiliated with this Home
-
Steven Cohen Team
Seller's Agent in 2024
Steven Cohen Team
Keller Williams Realty Boston-Metro | Back Bay
(617) 861-3636
8 in this area
483 Total Sales
-
Josh Leibowitz
J
Seller Co-Listing Agent in 2024
Josh Leibowitz
Keller Williams Realty Boston-Metro | Back Bay
1 in this area
20 Total Sales
-
Suresh Patel
S
Buyer's Agent in 2024
Suresh Patel
Suresh R. Patel Realty
(978) 685-4647
1 in this area
7 Total Sales
-
E
Seller's Agent in 2019
Erin Moynihan
Fenway Realty
-
Brian Caluori
Buyer's Agent in 2019
Brian Caluori
Gibson Sothebys International Realty
(518) 423-0309
84 Total Sales
-
V
Seller's Agent in 2017
Vanessa Duguerre
Coldwell Banker Realty - Easton
Map
Source: MLS Property Information Network (MLS PIN)
MLS Number: 73244635
APN: ROXB-000000-000009-001140-000004
Disclaimer: Certain information contained herein is derived from information provided by parties other than Homes.com. All information provided is deemed reliable, but is not guaranteed to be accurate and should be independently verified.
![]() The property listing data and information, or the Images, set forth herein were provided to MLS Property Information Network, Inc. from third party sources, including sellers, lessors and public records, and were compiled by MLS Property Information Network, Inc. The property listing data and information, and the Images, are for the personal, non-commercial use of consumers having a good faith interest in purchasing or leasing listed properties of the type displayed to them and may not be used for any purpose other than to identify prospective properties which such consumers may have a good faith interest in purchasing or leasing. MLS Property Information Network, Inc. and its subscribers disclaim any and all representations and warranties as to the accuracy of the property listing data and information, or as to the accuracy of any of the Images, set forth herein.
The property listing data and information, or the Images, set forth herein were provided to MLS Property Information Network, Inc. from third party sources, including sellers, lessors and public records, and were compiled by MLS Property Information Network, Inc. The property listing data and information, and the Images, are for the personal, non-commercial use of consumers having a good faith interest in purchasing or leasing listed properties of the type displayed to them and may not be used for any purpose other than to identify prospective properties which such consumers may have a good faith interest in purchasing or leasing. MLS Property Information Network, Inc. and its subscribers disclaim any and all representations and warranties as to the accuracy of the property listing data and information, or as to the accuracy of any of the Images, set forth herein.
Nearby Homes
- 239 Northampton St
- 531 Massachusetts Ave Unit 1
- 257 Northampton St Unit 409
- 257 Northampton St Unit U509
- 257 Northampton St Unit 308
- 263-265 Northampton St Unit 206
- 492 Massachusetts Ave Unit 53
- 492 Massachusetts Ave Unit 63
- 455 Massachusetts Ave Unit 2
- 455 Massachusetts Ave Unit 4
- 470 Massachusetts Ave Unit 1
- 196 W Springfield St Unit 1
- 451-453 Massachusetts Ave Unit 8
- 460 Massachusetts Ave Unit B
- 203 W Springfield St Unit A
- 211 W Springfield St
- 213 W Springfield St
- 566 Columbus Ave Unit 614
- 566 Columbus Ave Unit 405
- 86 Worcester St Unit 4