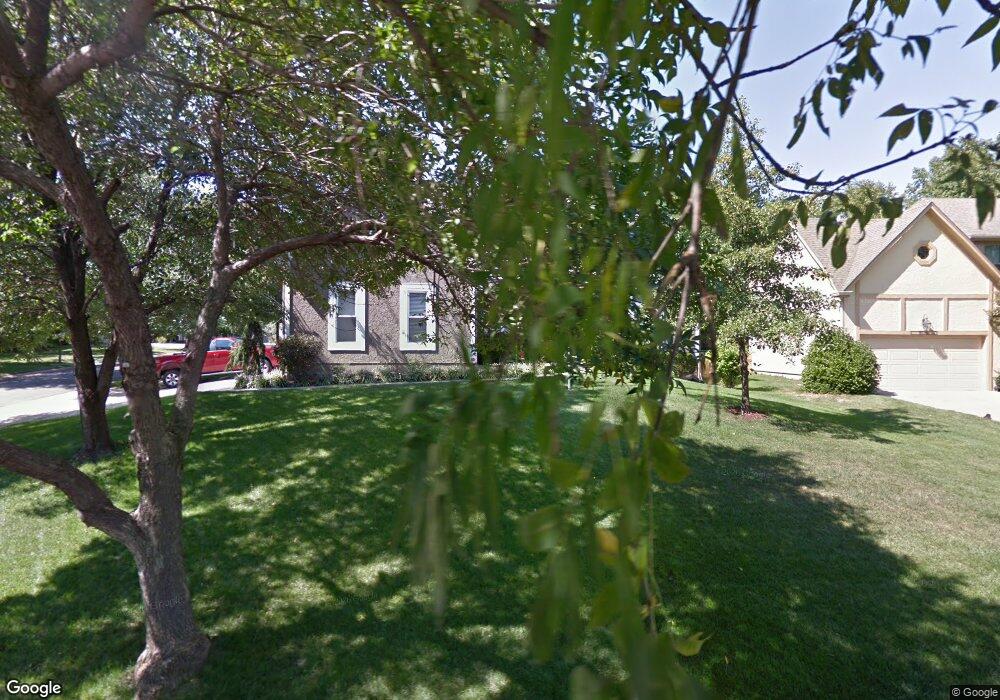
8020 Constance St Lenexa, KS 66215
Estimated Value: $488,000 - $557,000
4
Beds
4
Baths
2,926
Sq Ft
$179/Sq Ft
Est. Value
About This Home
This home is located at 8020 Constance St, Lenexa, KS 66215 and is currently estimated at $524,389, approximately $179 per square foot. 8020 Constance St is a home located in Johnson County with nearby schools including Rising Star Elementary School, Westridge Middle School, and Shawnee Mission West High School.
Ownership History
Date
Name
Owned For
Owner Type
Purchase Details
Closed on
Jun 28, 2019
Sold by
Abell Linda P and Peterson Ronald Ernest
Bought by
Abell Linda P and The Linda P Abell Revocable Tr
Current Estimated Value
Purchase Details
Closed on
Jun 20, 2013
Sold by
Abell Linda P and Peterson Ronald Ernest
Bought by
Abell Linda P and Peterson Ronald Ernest
Home Financials for this Owner
Home Financials are based on the most recent Mortgage that was taken out on this home.
Original Mortgage
$166,000
Interest Rate
3.43%
Mortgage Type
New Conventional
Purchase Details
Closed on
Dec 5, 2001
Sold by
Griffith Robert K
Bought by
Griffith Rebecca J
Home Financials for this Owner
Home Financials are based on the most recent Mortgage that was taken out on this home.
Original Mortgage
$153,000
Interest Rate
5.37%
Create a Home Valuation Report for This Property
The Home Valuation Report is an in-depth analysis detailing your home's value as well as a comparison with similar homes in the area
Home Values in the Area
Average Home Value in this Area
Purchase History
| Date | Buyer | Sale Price | Title Company |
|---|---|---|---|
| Abell Linda P | -- | None Available | |
| Abell Linda P | -- | All American Title Co | |
| Griffith Rebecca J | -- | Chicago Title Insurance Co |
Source: Public Records
Mortgage History
| Date | Status | Borrower | Loan Amount |
|---|---|---|---|
| Closed | Abell Linda P | $166,000 | |
| Closed | Griffith Rebecca J | $153,000 |
Source: Public Records
Tax History
| Year | Tax Paid | Tax Assessment Tax Assessment Total Assessment is a certain percentage of the fair market value that is determined by local assessors to be the total taxable value of land and additions on the property. | Land | Improvement |
|---|---|---|---|---|
| 2025 | $5,780 | $54,395 | $10,648 | $43,747 |
| 2023 | $5,860 | $52,083 | $9,262 | $42,821 |
| 2022 | $5,275 | $46,851 | $8,055 | $38,796 |
| 2021 | $4,922 | $41,549 | $7,660 | $33,889 |
| 2020 | $4,744 | $39,640 | $7,660 | $31,980 |
| 2019 | $4,625 | $38,628 | $7,660 | $30,968 |
| 2018 | $4,530 | $37,501 | $7,660 | $29,841 |
| 2017 | $4,378 | $35,121 | $6,054 | $29,067 |
| 2016 | $4,226 | $33,477 | $6,054 | $27,423 |
| 2015 | $4,063 | $32,407 | $6,054 | $26,353 |
| 2013 | -- | $30,291 | $6,054 | $24,237 |
Source: Public Records
Map
Nearby Homes
- 8004 Constance St
- 14925 W 82nd Terrace
- 8041 Acuff Ln
- 8117 Woodstone St
- 15318 W 80th Place
- 7736 Darnell St
- 8003 Mullen Rd
- 7618 Constance St
- 8403 Swarner Dr
- 8362 Oakview Cir
- 8443 Alden St
- 7633 Acuff Ln
- 7619 Twilight Ln
- 16006 W 80th Place
- 7908 Park St
- 13511 W 82nd St
- 7325 Oakview St
- 13403 W 78th Place
- 7239 Allman Rd
- 7221 Allman Rd
- 8016 Constance St
- 8021 Lingle Ln
- 8102 Constance St
- 8015 Lingle Ln
- 8012 Constance St
- 8021 Constance St
- 8101 Lingle Ln
- 8009 Lingle Ln
- 8106 Constance St
- 14729 W 81st St
- 8015 Constance St
- 8008 Constance St
- 8003 Lingle Ln
- 8107 Lingle Ln
- 14725 W 81st St
- 8022 Lingle Ln
- 8110 Constance St
- 14724 W 81st St
- 8028 Lingle Ln
- 8016 Lingle Ln
Your Personal Tour Guide
Ask me questions while you tour the home.