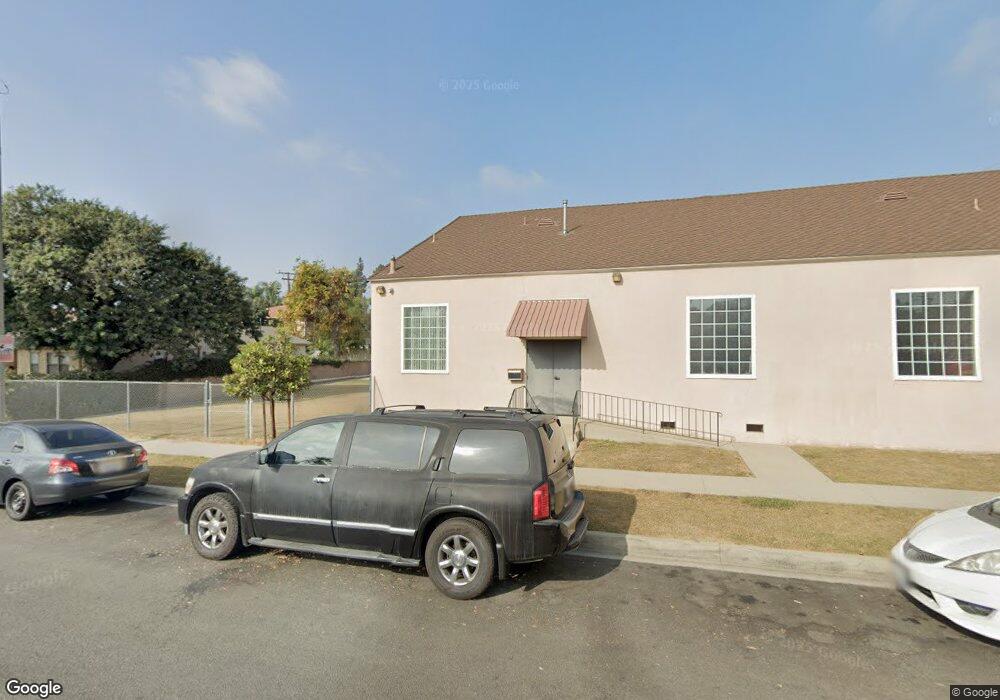
8022 1/2 Telegraph Rd Unit 6 Downey, CA 90240
Estimated Value: $649,642 - $755,000
3
Beds
2
Baths
1,476
Sq Ft
$471/Sq Ft
Est. Value
About This Home
This home is located at 8022 1/2 Telegraph Rd Unit 6, Downey, CA 90240 and is currently estimated at $694,911, approximately $470 per square foot. 8022 1/2 Telegraph Rd Unit 6 is a home located in Los Angeles County with nearby schools including Unsworth Elementary School, Griffiths Middle School, and Warren High School.
Ownership History
Date
Name
Owned For
Owner Type
Purchase Details
Closed on
Jul 23, 2018
Sold by
Chan Lily
Bought by
Chan Lily and The Lily Chan Revocable Living
Current Estimated Value
Purchase Details
Closed on
Jan 4, 2012
Sold by
Genova Capital Inc
Bought by
Chan Lily
Home Financials for this Owner
Home Financials are based on the most recent Mortgage that was taken out on this home.
Original Mortgage
$185,500
Outstanding Balance
$126,747
Interest Rate
3.91%
Mortgage Type
New Conventional
Estimated Equity
$568,164
Purchase Details
Closed on
Oct 5, 2011
Sold by
Yi Eddie and Yi Kathy
Bought by
Genova Capital Inc
Purchase Details
Closed on
Aug 24, 2005
Sold by
Bhuptani Bharat and Abboud Tony
Bought by
Yi Eddie and Yi Kathy
Home Financials for this Owner
Home Financials are based on the most recent Mortgage that was taken out on this home.
Original Mortgage
$325,000
Interest Rate
5.61%
Mortgage Type
Fannie Mae Freddie Mac
Create a Home Valuation Report for This Property
The Home Valuation Report is an in-depth analysis detailing your home's value as well as a comparison with similar homes in the area
Home Values in the Area
Average Home Value in this Area
Purchase History
| Date | Buyer | Sale Price | Title Company |
|---|---|---|---|
| Chan Lily | -- | None Available | |
| Chan Lily | $272,000 | First American Title Company | |
| Genova Capital Inc | $199,000 | Servicelink | |
| Yi Eddie | $525,000 | -- |
Source: Public Records
Mortgage History
| Date | Status | Borrower | Loan Amount |
|---|---|---|---|
| Open | Chan Lily | $185,500 | |
| Previous Owner | Yi Eddie | $325,000 |
Source: Public Records
Tax History Compared to Growth
Tax History
| Year | Tax Paid | Tax Assessment Tax Assessment Total Assessment is a certain percentage of the fair market value that is determined by local assessors to be the total taxable value of land and additions on the property. | Land | Improvement |
|---|---|---|---|---|
| 2025 | $4,421 | $341,634 | $89,048 | $252,586 |
| 2024 | $4,421 | $334,936 | $87,302 | $247,634 |
| 2023 | $4,274 | $328,370 | $85,591 | $242,779 |
| 2022 | $4,062 | $321,932 | $83,913 | $238,019 |
| 2021 | $3,964 | $315,620 | $82,268 | $233,352 |
| 2019 | $3,863 | $306,261 | $79,829 | $226,432 |
| 2018 | $3,753 | $300,257 | $78,264 | $221,993 |
| 2016 | $3,633 | $288,600 | $75,226 | $213,374 |
| 2015 | $3,583 | $284,266 | $74,097 | $210,169 |
| 2014 | $3,386 | $278,699 | $72,646 | $206,053 |
Source: Public Records
Map
Nearby Homes
- 7850 Birchcrest Rd
- 8514 Smallwood Ave
- 7700 Bangle Rd
- 8322 Vista Del Rosa St
- 8331 Vista Del Rosa St
- 8925 Stamps Rd
- 7310 Bluff Rd
- 8339 Manzanar Ave
- 8314 Manzanar Ave
- 6502 Dos Rios Rd
- 9305 Downey Ave
- 7163 Watcher St
- 7343 Hannon St
- 8826 Bermudez St
- 7708 Birchleaf Ave
- 7645 Manzanar Ave
- 9509 Downey Ave
- 7019 Lanto St
- 9229 Brookshire Ave
- 9246 Manzanar Ave
- 8026 Telegraph Rd Unit 1/2
- 8022 1/2 Telegraph Rd Unit 1/2
- 8022 Telegraph Rd Unit 7
- 8014 Telegraph Rd Unit 15
- 8024 Telegraph Rd Unit 5
- 8026 Telegraph Rd Unit 1/2
- 8022 Telegraph Rd Unit 1/2
- 8016 1/2 Telegraph Rd Unit 12
- 8022 Telegraph Rd
- 8024 Telegraph Rd
- 8026 Telegraph Rd
- 8020 Telegraph Rd
- 8026 Telegraph Rd
- 8014 Telegraph Rd
- 8014 1/2 Telegraph Rd Unit 14
- 8020 1/2 Telegraph Rd Unit 8
- 8024 Telegraph Rd
- 8024 1/2 Telegraph Rd
- 8018 Telegraph Rd Unit 11
- 8028 Telegraph Rd Unit 1