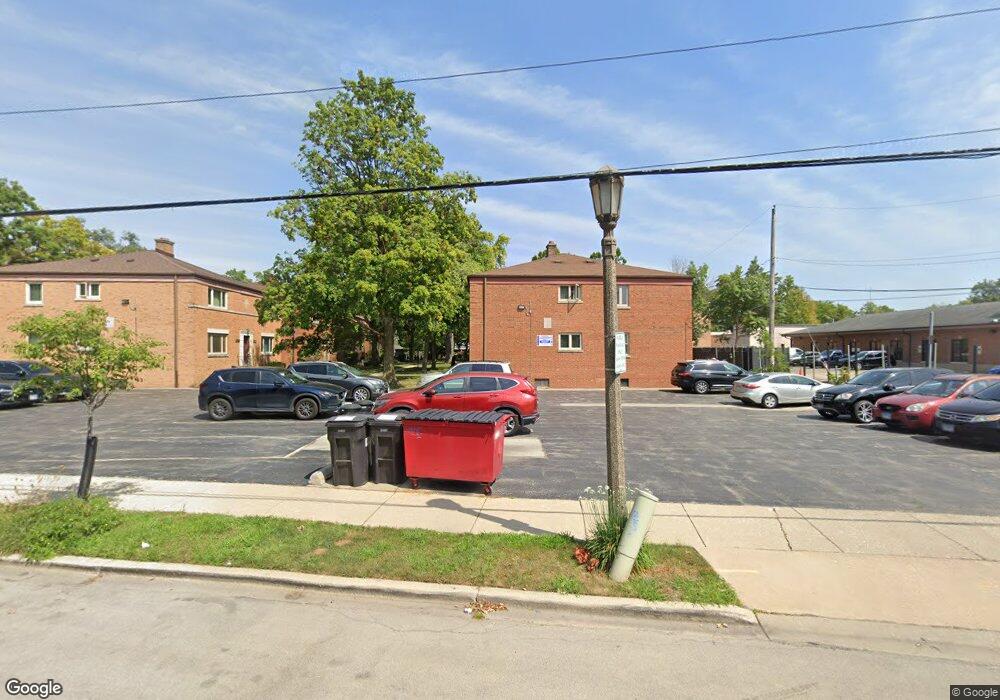
8023 Lake St Unit 1S River Forest, IL 60305
Estimated Value: $180,000 - $191,000
2
Beds
1
Bath
800
Sq Ft
$233/Sq Ft
Est. Value
About This Home
This home is located at 8023 Lake St Unit 1S, River Forest, IL 60305 and is currently estimated at $186,570, approximately $233 per square foot. 8023 Lake St Unit 1S is a home located in Cook County with nearby schools including Lincoln Elementary School, Roosevelt Middle School, and Oak Park and River Forest High School.
Ownership History
Date
Name
Owned For
Owner Type
Purchase Details
Closed on
Jul 18, 2024
Sold by
Foster Diane J
Bought by
Pardo Leonel and Vargas Rosa
Current Estimated Value
Purchase Details
Closed on
Jun 17, 2021
Sold by
Watkins Cain Danielle and Watkins Danielle C
Bought by
Foster Diane J
Purchase Details
Closed on
Sep 17, 2015
Sold by
Danali Holdings Llc
Bought by
Watkins Danielle C
Home Financials for this Owner
Home Financials are based on the most recent Mortgage that was taken out on this home.
Original Mortgage
$108,498
Interest Rate
3.75%
Mortgage Type
FHA
Purchase Details
Closed on
Jun 23, 2008
Sold by
Rush Georgia H
Bought by
Donali Holdings Llc
Purchase Details
Closed on
Jan 30, 1998
Sold by
Severson Helen M
Bought by
Rush Georgia H
Purchase Details
Closed on
Sep 30, 1994
Sold by
Severson Carol
Bought by
Severson Helen M
Create a Home Valuation Report for This Property
The Home Valuation Report is an in-depth analysis detailing your home's value as well as a comparison with similar homes in the area
Home Values in the Area
Average Home Value in this Area
Purchase History
| Date | Buyer | Sale Price | Title Company |
|---|---|---|---|
| Pardo Leonel | $165,000 | None Listed On Document | |
| Foster Diane J | $157,500 | Chicago Title Insurance Co | |
| Watkins Danielle C | $110,500 | Attorneys Title Guaranty Fun | |
| Donali Holdings Llc | $150,000 | Commonwealth Land Title Insu | |
| Rush Georgia H | -- | -- | |
| Severson Helen M | $73,000 | Land Title Group Inc |
Source: Public Records
Mortgage History
| Date | Status | Borrower | Loan Amount |
|---|---|---|---|
| Previous Owner | Watkins Danielle C | $108,498 |
Source: Public Records
Tax History Compared to Growth
Tax History
| Year | Tax Paid | Tax Assessment Tax Assessment Total Assessment is a certain percentage of the fair market value that is determined by local assessors to be the total taxable value of land and additions on the property. | Land | Improvement |
|---|---|---|---|---|
| 2024 | $4,026 | $14,709 | $1,469 | $13,240 |
| 2023 | $3,840 | $14,709 | $1,469 | $13,240 |
| 2022 | $3,840 | $11,894 | $1,503 | $10,391 |
| 2021 | $2,663 | $11,892 | $1,502 | $10,390 |
| 2020 | $2,671 | $11,892 | $1,502 | $10,390 |
| 2019 | $2,366 | $11,050 | $1,366 | $9,684 |
| 2018 | $2,238 | $11,050 | $1,366 | $9,684 |
| 2017 | $2,247 | $11,050 | $1,366 | $9,684 |
| 2016 | $1,578 | $7,403 | $1,127 | $6,276 |
| 2015 | $1,511 | $7,403 | $1,127 | $6,276 |
| 2014 | $1,399 | $7,403 | $1,127 | $6,276 |
| 2013 | $1,537 | $8,078 | $1,127 | $6,951 |
Source: Public Records
Map
Nearby Homes
- 8129 Lake St
- 500 Auvergne Place
- 8213 Lake St
- 424 Park Ave Unit 205
- 424 Park Ave Unit 204
- 424 Park Ave Unit 206
- 414 Franklin Ave Unit 3A
- 310 S 2nd Ave
- 411 Ashland Ave Unit 1A
- 18 Gale Ave
- 407 Ashland Ave Unit 5F
- 407 Ashland Ave Unit 3G
- 534 Lathrop Ave
- 7952 Madison St Unit 2E
- 608 S 2nd Ave
- 7575 Lake St Unit 5C
- 547 Jackson Ave
- 902 S 3rd Ave Unit A
- 310 Lathrop Ave Unit P52
- 601 S 6th Ave
- 8023 Lake St Unit 80232
- 8023 Lake St Unit 1
- 8023 Lake St Unit 2
- 8021 Lake St Unit 80211
- 8021 Lake St Unit 80212
- 8021 Lake St Unit 1
- 8025 Lake St Unit 80252
- 8025 Lake St Unit 80251
- 8025 Lake St Unit 1
- 8027 Lake St Unit 80272
- 8027 Lake St Unit 80271
- 8027 Lake St Unit 2
- 8027 Lake St Unit 1S
- 8019 Lake St Unit 80192
- 8019 Lake St Unit 1
- 8017 Lake St Unit 80171
- 8017 Lake St Unit 80172
- 8017 Lake St Unit 2
- 8017 Lake St Unit 1
- 8039 Lake St Unit 1