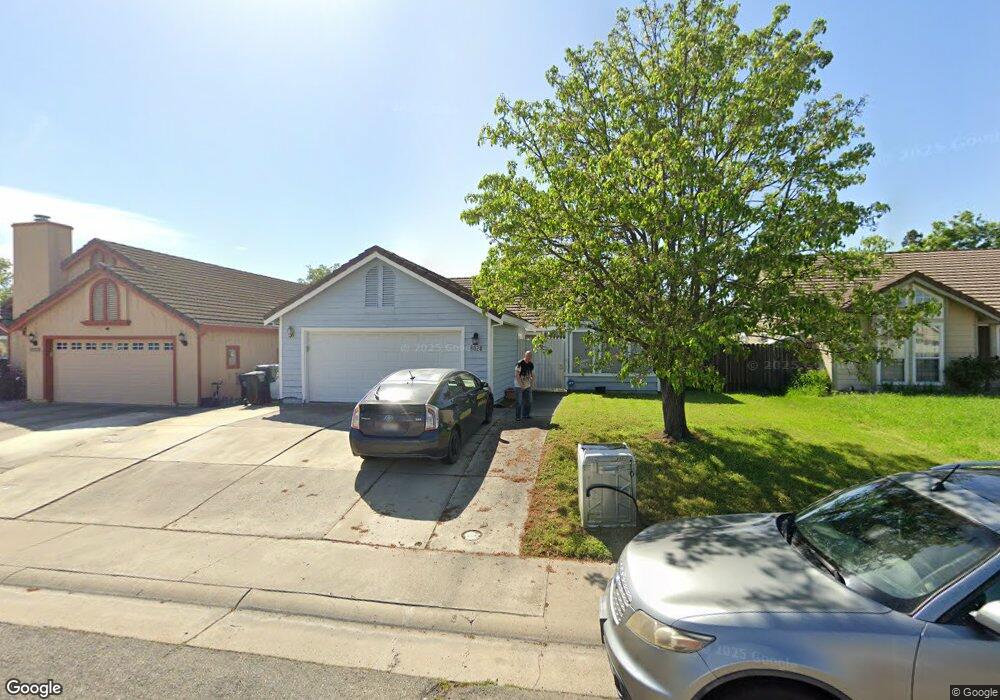
8024 Parkgate Way Sacramento, CA 95828
Estimated Value: $462,759 - $487,000
3
Beds
2
Baths
1,482
Sq Ft
$322/Sq Ft
Est. Value
About This Home
This home is located at 8024 Parkgate Way, Sacramento, CA 95828 and is currently estimated at $476,690, approximately $321 per square foot. 8024 Parkgate Way is a home located in Sacramento County with nearby schools including Isabelle Jackson Elementary School, James Rutter Middle School, and Florin High School.
Ownership History
Date
Name
Owned For
Owner Type
Purchase Details
Closed on
Jul 1, 2009
Sold by
Liu Yacui and Lui Yacui
Bought by
Liu Yacui
Current Estimated Value
Purchase Details
Closed on
Apr 16, 2009
Sold by
The Bank Of New York
Bought by
Lui Yacui
Home Financials for this Owner
Home Financials are based on the most recent Mortgage that was taken out on this home.
Original Mortgage
$120,000
Outstanding Balance
$75,369
Interest Rate
4.82%
Mortgage Type
Purchase Money Mortgage
Estimated Equity
$401,321
Purchase Details
Closed on
Feb 11, 2009
Sold by
Vidal Joseph and Vidal Rowina
Bought by
The Bank Of New York
Purchase Details
Closed on
Oct 21, 2003
Sold by
Doiel Roger A and Doiel Bonnie L
Bought by
Vidal Joseph and Vidal Rowena
Home Financials for this Owner
Home Financials are based on the most recent Mortgage that was taken out on this home.
Original Mortgage
$228,000
Interest Rate
7.2%
Mortgage Type
Purchase Money Mortgage
Create a Home Valuation Report for This Property
The Home Valuation Report is an in-depth analysis detailing your home's value as well as a comparison with similar homes in the area
Home Values in the Area
Average Home Value in this Area
Purchase History
| Date | Buyer | Sale Price | Title Company |
|---|---|---|---|
| Liu Yacui | -- | Chicago Title Company | |
| Lui Yacui | $150,000 | Chicago Title Company | |
| The Bank Of New York | $111,760 | None Available | |
| Vidal Joseph | $240,000 | Alliance Title Company |
Source: Public Records
Mortgage History
| Date | Status | Borrower | Loan Amount |
|---|---|---|---|
| Open | Lui Yacui | $120,000 | |
| Previous Owner | Vidal Joseph | $228,000 |
Source: Public Records
Tax History Compared to Growth
Tax History
| Year | Tax Paid | Tax Assessment Tax Assessment Total Assessment is a certain percentage of the fair market value that is determined by local assessors to be the total taxable value of land and additions on the property. | Land | Improvement |
|---|---|---|---|---|
| 2025 | $2,265 | $193,146 | $57,939 | $135,207 |
| 2024 | $2,265 | $189,359 | $56,803 | $132,556 |
| 2023 | $2,213 | $185,647 | $55,690 | $129,957 |
| 2022 | $2,178 | $182,008 | $54,599 | $127,409 |
| 2021 | $2,156 | $178,440 | $53,529 | $124,911 |
| 2020 | $2,129 | $176,612 | $52,981 | $123,631 |
| 2019 | $2,094 | $173,150 | $51,943 | $121,207 |
| 2018 | $2,042 | $169,756 | $50,925 | $118,831 |
| 2017 | $2,010 | $166,428 | $49,927 | $116,501 |
| 2016 | $1,916 | $163,166 | $48,949 | $114,217 |
| 2015 | $1,883 | $160,716 | $48,214 | $112,502 |
| 2014 | $1,855 | $157,569 | $47,270 | $110,299 |
Source: Public Records
Map
Nearby Homes
- 8437 Yermo Way
- 8336 Cutler Way
- 8346 Floxtree Ct
- 8510 Cavendish Way
- 8251 Apple Cove Ct
- 8336 Summer Sunset Dr
- 8233 Short Rd
- 8317 Honeycomb Way
- 8548 Whitby Ct
- 8159 Morgan Hill Way
- 8216 Exbourne Cir
- 8266 Summer Sunset Dr
- 7905 Springarden Way
- 8282 Union Creek Way
- 8329 Spengler Dr
- 8186 Gustine Way
- 7855 Cottonwood Ln Unit 118
- 7855 Cottonwood Ln Unit 54
- 7855 Cottonwood Ln Unit 35
- 8077 Goran Ct
- 8020 Parkgate Way
- 8028 Parkgate Way
- 8025 Spengler Dr
- 8016 Parkgate Way
- 8021 Spengler Dr
- 8029 Spengler Dr
- 8025 Parkgate Way
- 8021 Parkgate Way
- 8017 Spengler Dr
- 8029 Parkgate Way
- 8012 Parkgate Way
- 8017 Parkgate Way
- 8412 Wheatland Dr
- 8408 Wheatland Dr
- 8013 Spengler Dr
- 8416 Wheatland Dr
- 8404 Wheatland Dr
- 8013 Parkgate Way
- 8008 Parkgate Way
- 8420 Wheatland Dr