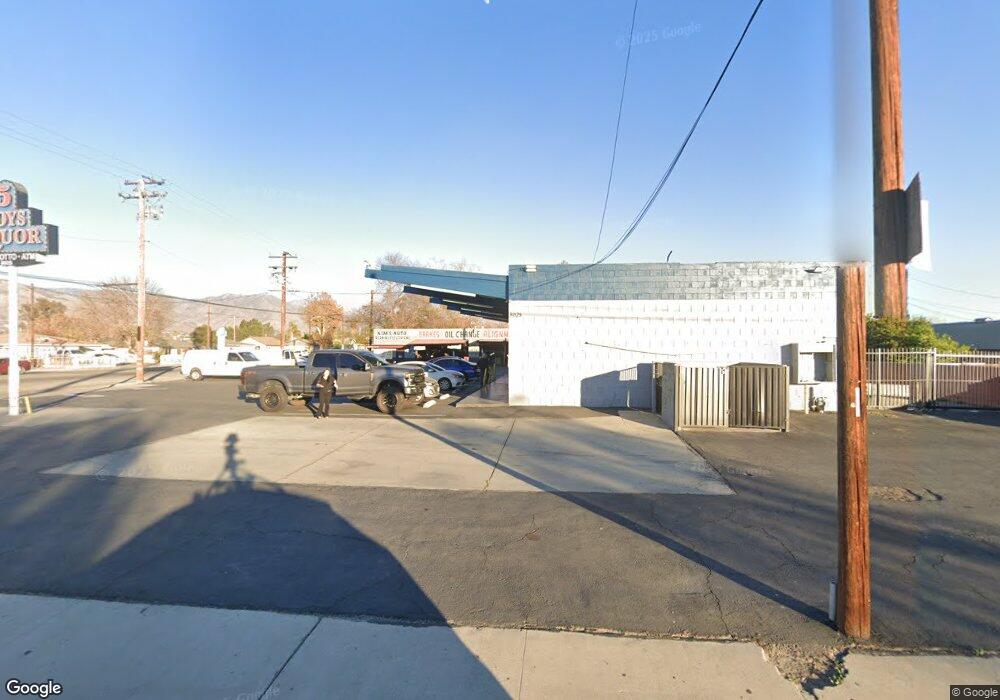
8025 Tippecanoe Ave San Bernardino, CA 92410
International NeighborhoodEstimated Value: $1,344,249
2
Beds
1
Bath
2,535
Sq Ft
$530/Sq Ft
Est. Value
About This Home
This home is located at 8025 Tippecanoe Ave, San Bernardino, CA 92410 and is currently estimated at $1,344,249, approximately $530 per square foot. 8025 Tippecanoe Ave is a home located in San Bernardino County with nearby schools including Bing Wong Elementary School, Curtis Middle School, and Indian Springs High.
Ownership History
Date
Name
Owned For
Owner Type
Purchase Details
Closed on
Apr 14, 2020
Sold by
Alchehayed Mansour
Bought by
5 Boys Liquor Inc
Current Estimated Value
Home Financials for this Owner
Home Financials are based on the most recent Mortgage that was taken out on this home.
Original Mortgage
$560,000
Outstanding Balance
$497,948
Interest Rate
3.6%
Mortgage Type
Commercial
Estimated Equity
$846,301
Purchase Details
Closed on
Dec 2, 2017
Sold by
Alchehayed Albira
Bought by
Alchehayed Mansour
Home Financials for this Owner
Home Financials are based on the most recent Mortgage that was taken out on this home.
Original Mortgage
$200,000
Interest Rate
3.9%
Mortgage Type
Purchase Money Mortgage
Purchase Details
Closed on
Oct 27, 2017
Sold by
Park Heung Joo and Park Hae Ryon
Bought by
Alchehayed Mansour
Home Financials for this Owner
Home Financials are based on the most recent Mortgage that was taken out on this home.
Original Mortgage
$200,000
Interest Rate
3.9%
Mortgage Type
Purchase Money Mortgage
Create a Home Valuation Report for This Property
The Home Valuation Report is an in-depth analysis detailing your home's value as well as a comparison with similar homes in the area
Home Values in the Area
Average Home Value in this Area
Purchase History
| Date | Buyer | Sale Price | Title Company |
|---|---|---|---|
| 5 Boys Liquor Inc | $800,000 | Orange Coast Title Co | |
| Alchehayed Mansour | -- | Ticor Title | |
| Alchehayed Mansour | $700,000 | Ticor Title |
Source: Public Records
Mortgage History
| Date | Status | Borrower | Loan Amount |
|---|---|---|---|
| Open | 5 Boys Liquor Inc | $560,000 | |
| Previous Owner | Alchehayed Mansour | $200,000 | |
| Previous Owner | Alchehayed Mansour | $720,000 |
Source: Public Records
Tax History Compared to Growth
Tax History
| Year | Tax Paid | Tax Assessment Tax Assessment Total Assessment is a certain percentage of the fair market value that is determined by local assessors to be the total taxable value of land and additions on the property. | Land | Improvement |
|---|---|---|---|---|
| 2025 | $8,563 | $683,528 | $109,364 | $574,164 |
| 2024 | $8,563 | $670,126 | $107,220 | $562,906 |
| 2023 | $8,357 | $656,987 | $105,118 | $551,869 |
| 2022 | $8,406 | $644,105 | $103,057 | $541,048 |
| 2021 | $8,433 | $631,475 | $101,036 | $530,439 |
| 2020 | $6,410 | $468,180 | $104,040 | $364,140 |
| 2019 | $6,219 | $459,000 | $102,000 | $357,000 |
| 2018 | $2,389 | $162,061 | $37,961 | $124,100 |
| 2017 | $2,323 | $158,884 | $37,217 | $121,667 |
| 2016 | $2,262 | $155,768 | $36,487 | $119,281 |
| 2015 | $2,299 | $153,428 | $35,939 | $117,489 |
| 2014 | $2,300 | $150,423 | $35,235 | $115,188 |
Source: Public Records
Map
Nearby Homes
- 0 E 5th St Unit DW25200285
- 0 E 5th St Unit PW25050863
- 0 E 5th St Unit PW25050852
- 8035 Tippecanoe Ave
- 7982 Whitlock Ave
- 24790 Monterey Ave
- 25046 3rd St
- 24744 5th St
- 24976 7th St
- 25180 E 5th St
- 24724 Court St
- 1086 E 2nd St
- 8035 Donna Dr
- 938 E 2nd St
- 8044 Michael Dr
- 868 E Rialto Ave
- 24549 Court St
- 8053 Del Rosa Ave
- 765 E 9th St
- 25481 6th St
- 24927 5th St
- 8033 Tippecanoe Ave
- 0 E 5th St Unit I12030735
- 0 E 5th St Unit I12031323
- 0 E 5th St Unit CV12152703
- 0 E 5th St Unit CV14023187
- 0 E 5th St Unit EV14196214
- 0 E 5th St Unit IG17172306
- 0 E 5th St Unit PW17017992
- 0 E 5th St Unit PW17018106
- 0 E 5th St Unit CRPW25050863
- 0 E 5th St Unit CRPW25050852
- 0 E 5th St Unit DW24171782
- 0 E 5th St Unit DW23208766
- 0 E 5th St Unit CV22056516
- 0 E 5th St Unit EV21201732
- 0 E 5th St Unit EV21201720
- 0 E 5th St Unit EV21199926
- 0 E 5th St Unit EV21199905
- 0 E 5th St Unit PW21026692