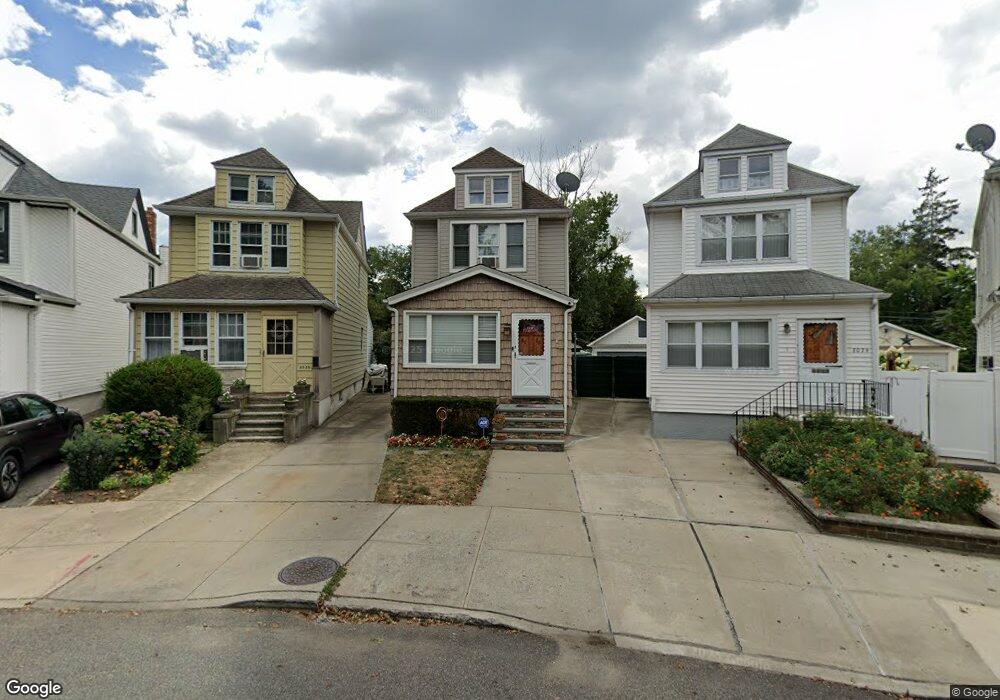
8026 62nd St Glendale, NY 11385
Glendale NeighborhoodEstimated Value: $862,000 - $927,000
Studio
--
Bath
1,684
Sq Ft
$531/Sq Ft
Est. Value
About This Home
This home is located at 8026 62nd St, Glendale, NY 11385 and is currently estimated at $893,530, approximately $530 per square foot. 8026 62nd St is a home located in Queens County with nearby schools including P.S. 68 - Cambridge, Joseph F. Quinn Intermediate School 77, and Sacred Heart School.
Ownership History
Date
Name
Owned For
Owner Type
Purchase Details
Closed on
Dec 3, 2012
Sold by
Ott Kenneth H and Rodolico Joan
Bought by
Mullarkey Michelle A and Mullarkey Stephen J
Current Estimated Value
Home Financials for this Owner
Home Financials are based on the most recent Mortgage that was taken out on this home.
Original Mortgage
$320,000
Outstanding Balance
$222,437
Interest Rate
3.44%
Mortgage Type
New Conventional
Estimated Equity
$671,093
Create a Home Valuation Report for This Property
The Home Valuation Report is an in-depth analysis detailing your home's value as well as a comparison with similar homes in the area
Home Values in the Area
Average Home Value in this Area
Purchase History
| Date | Buyer | Sale Price | Title Company |
|---|---|---|---|
| Mullarkey Michelle A | $420,000 | -- |
Source: Public Records
Mortgage History
| Date | Status | Borrower | Loan Amount |
|---|---|---|---|
| Open | Mullarkey Michelle A | $320,000 |
Source: Public Records
Tax History Compared to Growth
Tax History
| Year | Tax Paid | Tax Assessment Tax Assessment Total Assessment is a certain percentage of the fair market value that is determined by local assessors to be the total taxable value of land and additions on the property. | Land | Improvement |
|---|---|---|---|---|
| 2025 | $6,800 | $37,331 | $10,804 | $26,527 |
| 2024 | $7,081 | $35,254 | $10,089 | $25,165 |
| 2023 | $6,454 | $33,534 | $9,139 | $24,395 |
| 2022 | $6,064 | $49,980 | $15,420 | $34,560 |
| 2021 | $6,399 | $47,040 | $15,420 | $31,620 |
| 2020 | $6,289 | $40,440 | $15,420 | $25,020 |
| 2019 | $5,853 | $43,920 | $15,420 | $28,500 |
| 2018 | $5,399 | $27,945 | $12,802 | $15,143 |
| 2017 | $5,105 | $26,512 | $12,712 | $13,800 |
| 2016 | $4,990 | $26,512 | $12,712 | $13,800 |
| 2015 | $933 | $25,924 | $14,176 | $11,748 |
| 2014 | $933 | $24,482 | $16,059 | $8,423 |
Source: Public Records
Map
Nearby Homes
- 62-22 80th Rd
- 60-48 80th Ave
- 78-30 62nd St
- 62-53 80th Rd
- 7817 64th St
- 7842 64th Ln
- 78-14 64th Place
- 78-30 64th Ln
- 5922 Cooper Ave
- 60-38 78th Ave
- 8010 59th St
- 7818 65th St
- 6510 80th Ave
- 647 Cooper Ave
- 7520 64th Place
- 6020 Saint Felix Ave
- 75-16 62nd St
- 80-29 57th St
- 60-27 Saint Felix Ave
- 58-59 78th Ave