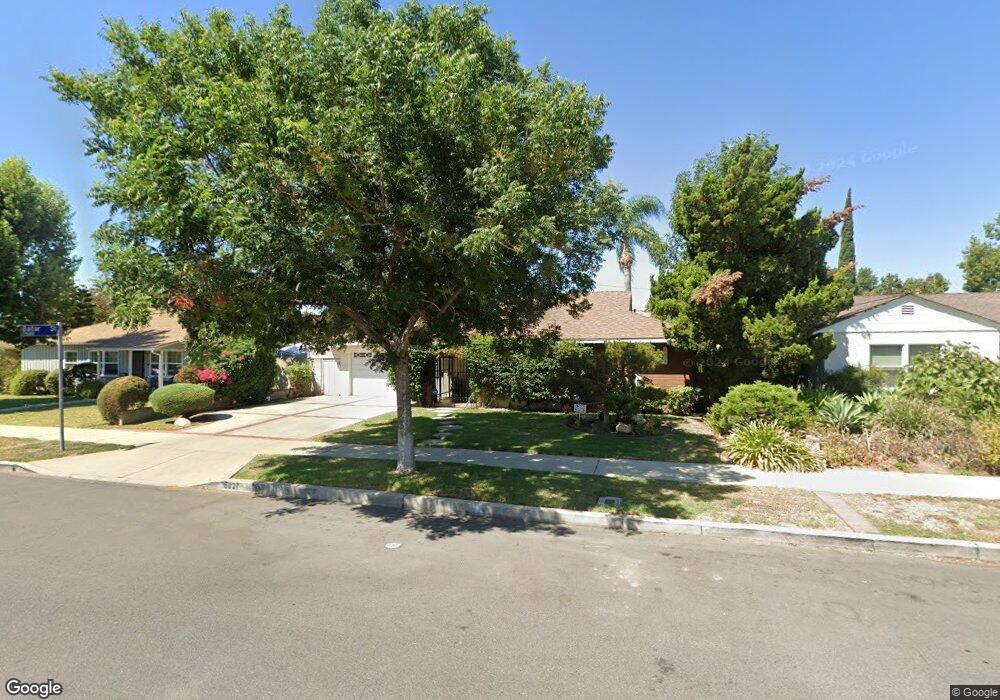
8027 Jellico Ave Northridge, CA 91325
Estimated Value: $806,000 - $846,000
2
Beds
1
Bath
1,268
Sq Ft
$647/Sq Ft
Est. Value
About This Home
This home is located at 8027 Jellico Ave, Northridge, CA 91325 and is currently estimated at $820,258, approximately $646 per square foot. 8027 Jellico Ave is a home located in Los Angeles County with nearby schools including Lorne Street Elementary, Northridge Middle School, and Northridge Academy High.
Ownership History
Date
Name
Owned For
Owner Type
Purchase Details
Closed on
Aug 10, 2022
Sold by
Bellina Mcfarland
Bought by
Bellina Lee Mcfarland Living Trust
Current Estimated Value
Purchase Details
Closed on
Mar 31, 2003
Sold by
Treitel Emanuel
Bought by
Mcfarland Bellina
Purchase Details
Closed on
Dec 4, 2002
Sold by
Garza Salvador J
Bought by
Treitel Emanuel
Home Financials for this Owner
Home Financials are based on the most recent Mortgage that was taken out on this home.
Original Mortgage
$220,000
Interest Rate
4.87%
Mortgage Type
Purchase Money Mortgage
Purchase Details
Closed on
Aug 12, 1993
Sold by
The Wedgewood Fund Xii
Bought by
Garza Salvador J
Home Financials for this Owner
Home Financials are based on the most recent Mortgage that was taken out on this home.
Original Mortgage
$121,200
Interest Rate
7.2%
Create a Home Valuation Report for This Property
The Home Valuation Report is an in-depth analysis detailing your home's value as well as a comparison with similar homes in the area
Home Values in the Area
Average Home Value in this Area
Purchase History
| Date | Buyer | Sale Price | Title Company |
|---|---|---|---|
| Bellina Lee Mcfarland Living Trust | -- | None Listed On Document | |
| Mcfarland Bellina | -- | None Available | |
| Treitel Emanuel | $275,000 | American Title Co | |
| Garza Salvador J | $151,500 | Stewart Title |
Source: Public Records
Mortgage History
| Date | Status | Borrower | Loan Amount |
|---|---|---|---|
| Previous Owner | Treitel Emanuel | $220,000 | |
| Previous Owner | Garza Salvador J | $121,200 |
Source: Public Records
Tax History Compared to Growth
Tax History
| Year | Tax Paid | Tax Assessment Tax Assessment Total Assessment is a certain percentage of the fair market value that is determined by local assessors to be the total taxable value of land and additions on the property. | Land | Improvement |
|---|---|---|---|---|
| 2025 | $4,362 | $349,746 | $258,790 | $90,956 |
| 2024 | $4,362 | $342,889 | $253,716 | $89,173 |
| 2023 | $4,280 | $336,167 | $248,742 | $87,425 |
| 2022 | $4,084 | $329,576 | $243,865 | $85,711 |
| 2021 | $4,030 | $323,115 | $239,084 | $84,031 |
| 2019 | $3,912 | $313,534 | $231,994 | $81,540 |
| 2018 | $3,833 | $307,388 | $227,446 | $79,942 |
| 2016 | $3,656 | $295,454 | $218,615 | $76,839 |
| 2015 | $3,603 | $291,017 | $215,332 | $75,685 |
| 2014 | $3,622 | $285,317 | $211,114 | $74,203 |
Source: Public Records
Map
Nearby Homes
- 8132 White Oak Ave
- 17529 Lanark St
- 17528 Willard St
- 8101 Bianca Ave
- 17751 Stagg St
- 17430 Hemmingway St
- 17424 Hemmingway St
- 7927 Chastain Place
- 7931 Lasaine Ave
- 17415 Stagg St
- 8300 Zelzah Ave
- 7848 Chastain Ave
- 7842 Lasaine Ave
- 17610 Chase St
- 17944 Schoenborn St
- 17956 Schoenborn St
- 17437 Chase St
- 18018 Schoenborn St
- 17232 Elkwood St
- 7545 White Oak Ave
- 8033 Jellico Ave
- 8021 Jellico Ave
- 8039 Jellico Ave
- 8015 Jellico Ave
- 8030 White Oak Ave
- 8024 White Oak Ave
- 8034 White Oak Ave
- 8020 White Oak Ave
- 17628 Baltar St
- 8040 White Oak Ave
- 8045 Jellico Ave
- 8009 Jellico Ave
- 8014 White Oak Ave
- 17625 Baltar St
- 8046 White Oak Ave
- 17624 Baltar St
- 17628 Lorne St
- 8008 White Oak Ave
- 8001 Jellico Ave
- 8051 Jellico Ave