
Seller's Agent in 2025
Scott Strevell
Keller Williams Realty Partners Inc.
(913) 274-9600
10 in this area
133 Total Sales
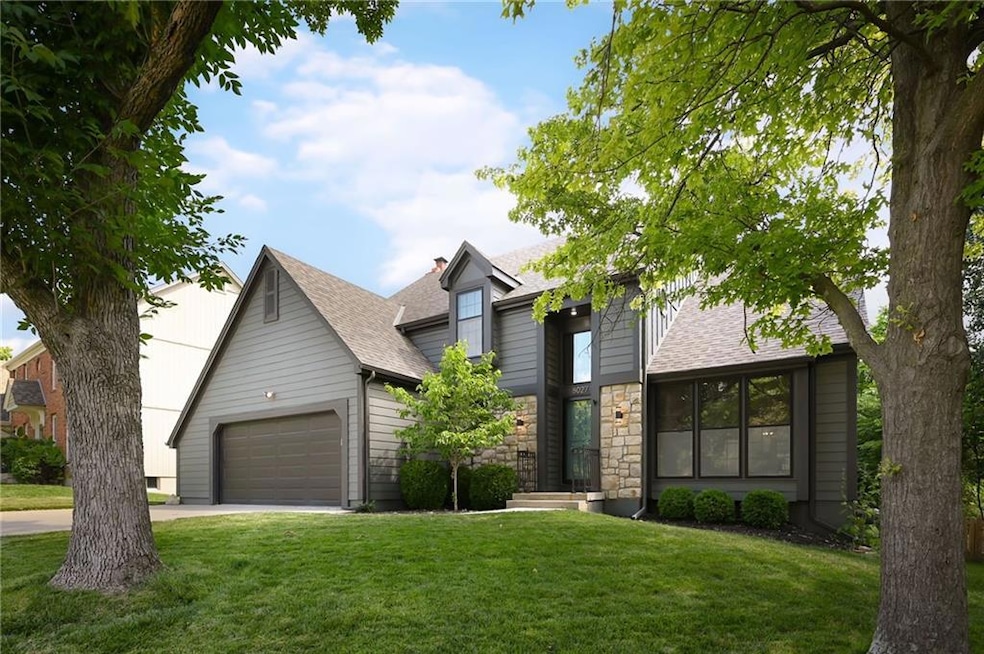
Clean lines and quiet confidence shape this 2-story home - where every detail contributes to a sense of calm, clarity, and space.
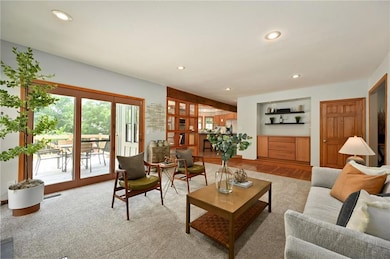
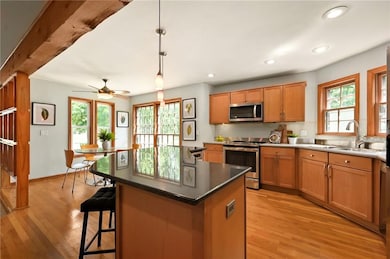
A grid-style open shelving divider - echoing mid-century modern sensibilities - transitions beautifully between the great room and breakfast nook. It's both functional and sculptural, providing subtle separation without blocking natural flow or sightlines.
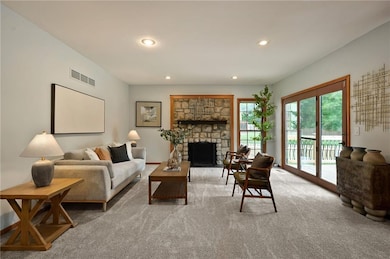
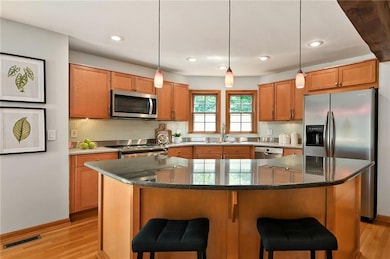
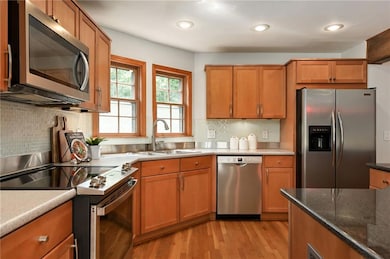
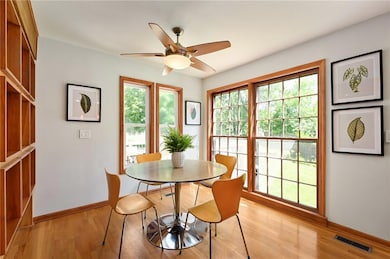
The kitchen pairs warm cabinetry with sleek stainless finishes and a generous island under pendant lighting - balancing utility with restrained design. Morning sun pours into the eat-in area through a wall of windows, framing views of the tree-lined backyard. Two distinct living areas bring versatility - one vaulted and bright, the other centered around a stone fireplace and opening to a newly built deck. New carpet, updated interior paint, and consistent finishes throughout create a crisp, move-in-ready feel.
The primary suite is calm and elevated, with vaulted ceilings, dual vessel sinks, a skylight, and a deep soaker tub.
Downstairs, the daylight basement features a finished rec room with built-ins - ideal for a media space, home gym, or creative workspace. An adjacent unfinished area invites future expansion or delivers generous storage.
With a roof and gutters just over six years old and a newer HVAC system, the essentials are solid. The aesthetic is contemporary with a nod to classic design—open, composed, and effortlessly livable.
Love clean design with substance? This one delivers. Reach out today to schedule your showing - homes with this kind of style don’t wait around.
Last Agent to Sell the Property
Keller Williams Realty Partners Inc. Brokerage Phone: 913-269-4269 License #BR00005214 Listed on: 07/14/2025
| Date | Type | Sale Price | Title Company |
|---|---|---|---|
| Warranty Deed | -- | Coffelt Land Title | |
| Warranty Deed | -- | Coffelt Land Title | |
| Deed | -- | Coffelt Land Title | |
| Deed | -- | Coffelt Land Title | |
| Interfamily Deed Transfer | -- | None Available | |
| Quit Claim Deed | -- | None Listed On Document | |
| Quit Claim Deed | -- | None Listed On Document | |
| Interfamily Deed Transfer | -- | None Available | |
| Interfamily Deed Transfer | -- | None Available |
| Date | Status | Loan Amount | Loan Type |
|---|---|---|---|
| Previous Owner | $155,000 | New Conventional |
| Date | Event | Price | List to Sale | Price per Sq Ft |
|---|---|---|---|---|
| 08/11/2025 08/11/25 | Sold | -- | -- | -- |
| 07/17/2025 07/17/25 | Pending | -- | -- | -- |
| 07/17/2025 07/17/25 | For Sale | $479,000 | -- | $170 / Sq Ft |
| Year | Tax Paid | Tax Assessment Tax Assessment Total Assessment is a certain percentage of the fair market value that is determined by local assessors to be the total taxable value of land and additions on the property. | Land | Improvement |
|---|---|---|---|---|
| 2025 | $5,196 | $50,692 | $10,908 | $39,784 |
| 2024 | $5,196 | $46,943 | $9,919 | $37,024 |
| 2023 | $4,900 | $43,527 | $9,447 | $34,080 |
| 2022 | $4,589 | $40,733 | $8,588 | $32,145 |
| 2021 | $4,208 | $35,443 | $7,811 | $27,632 |
| 2020 | $4,061 | $33,856 | $7,811 | $26,045 |
| 2019 | $3,927 | $32,718 | $6,775 | $25,943 |
| 2018 | $4,037 | $33,362 | $6,775 | $26,587 |
| 2017 | $3,729 | $29,842 | $6,151 | $23,691 |
| 2016 | $3,572 | $28,221 | $5,916 | $22,305 |
| 2015 | $3,528 | $28,072 | $5,916 | $22,156 |
| 2013 | -- | $24,875 | $5,916 | $18,959 |
Seller's Agent in 2025
Scott Strevell
Keller Williams Realty Partners Inc.
(913) 274-9600
10 in this area
133 Total Sales
Seller Co-Listing Agent in 2025
KC HOMES365 TEAM
Keller Williams Realty Partners Inc.
(913) 258-2000
17 in this area
296 Total Sales
Buyer's Agent in 2025
Jonas Barrish
Compass Realty Group
(913) 626-4708
8 in this area
225 Total Sales
Source: Heartland MLS
MLS Number: 2558838
APN: IP64000005-0012
Disclaimer: Certain information contained herein is derived from information provided by parties other than Homes.com. All information provided is deemed reliable, but is not guaranteed to be accurate and should be independently verified.
![]() Based on information submitted to the MLS Grid. All data is obtained from various sources and may not have been verified by broker or MLS GRID. Supplied Open House Information is subject to change without notice. All information should be independently reviewed and verified for accuracy. Properties may or may not be listed by the office/agent presenting the information. Some IDX listings have been excluded from this website. Prices displayed on all Sold listings are the Last Known Listing Price and may not be the actual selling price.
Based on information submitted to the MLS Grid. All data is obtained from various sources and may not have been verified by broker or MLS GRID. Supplied Open House Information is subject to change without notice. All information should be independently reviewed and verified for accuracy. Properties may or may not be listed by the office/agent presenting the information. Some IDX listings have been excluded from this website. Prices displayed on all Sold listings are the Last Known Listing Price and may not be the actual selling price.
Listing Information presented by local MLS brokerage: TEN-X, INC., local REALTOR®- Arlene Richardson - (888) 952-6393
Based on information submitted to the MLS GRID.
Ask me questions while you tour the home.