
Landlord's Agent in 2023
Ann Malcolm
Malcolm Real Estate, Inc.
(202) 333-8500
7 Total Sales
Estimated Value: $507,693 - $601,000
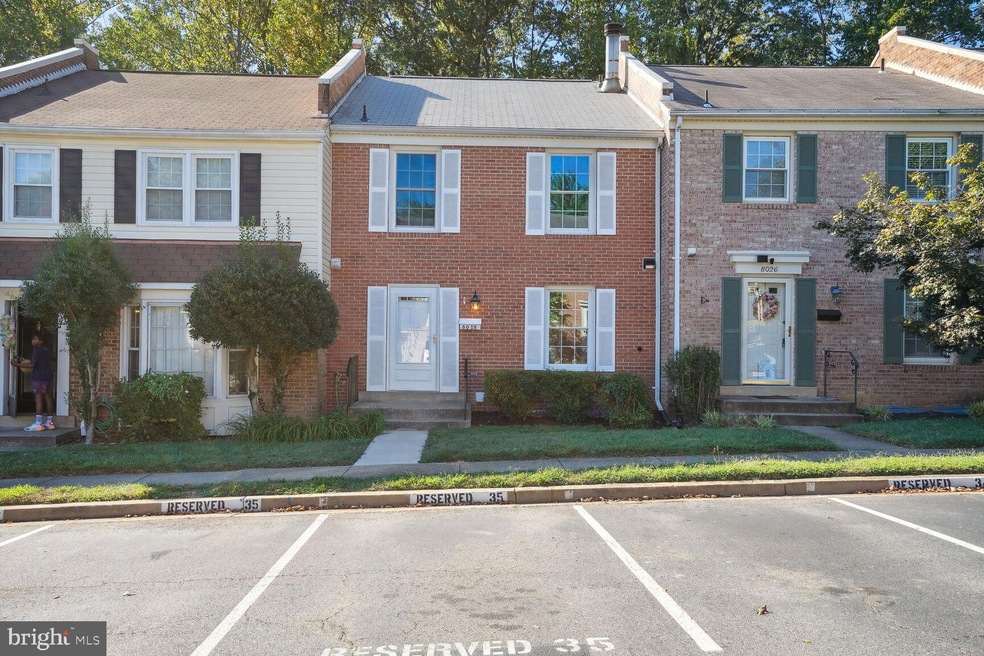
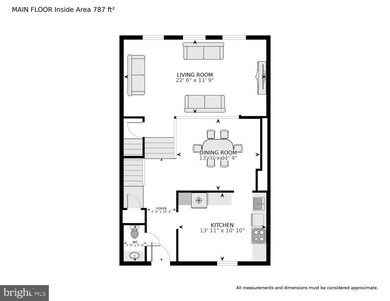
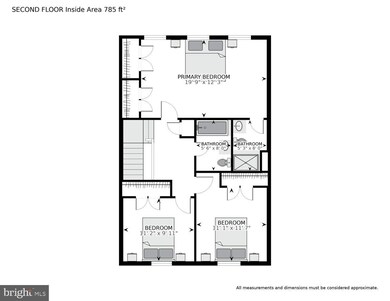
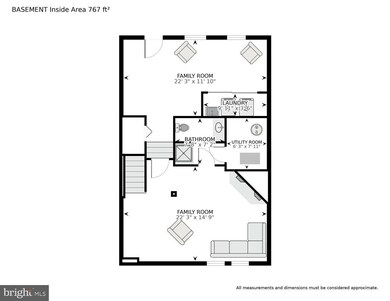
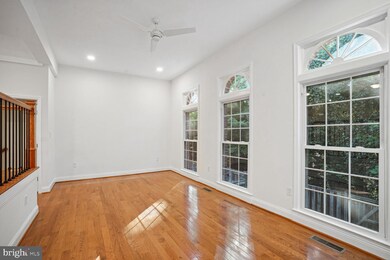
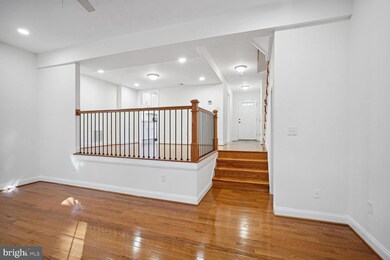
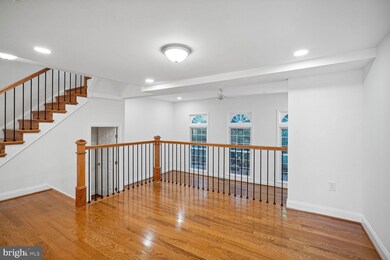
This home is gorgeous and is like new. Renovations just finished. Over 2,300 s.f. of finished space. Totally refreshed large townhouse with 3 bedrooms & 3.5 new baths, living room with 11 foot high ceiling in dramatic sunken living room which overlooks woods through large Palladian insulated windows, new wood floors on main & upper level (living room, dining room, stairs, & 3 bedrooms), new kitchen cabinets with new stainless steel appliances & porcelain tile floors & granite countertops, upper kitchen cabinets are 42 inches high to provide for extra storage, eating space in kitchen in addition to separate dining room, 3.5 new bathrooms with taller vanities & granite countertops, higher shower heads in 2 bathrooms upstairs, new vinyl plank floors in cozy rec room which has a wood burning fireplace & recessed lighting, game room with laundry closet that has a full sized washer & dryer, walk out to brick patio for all your barbeques, 2 assigned parking spaces, HOA mows the front lawn. The Townhouses of Saratoga community is near the intersection of Rolling Road, Barta Road & the Fairfax County Parkway. It is close to the park & ride at Barta Road & Rolling Road, has an easy commute to DC, the Pentagon, Belvoir North, & is near the Springfield Metro, neighborhood shopping and restaurants. Sorry, no smoking, pets on a case by case basis. Available now.
Last Agent to Rent the Property
(703) 967-6403 malcolmrealestate@yahoo.com Malcolm Real Estate, Inc. License #9898989 Listed on: 08/31/2023
| Date | Event | Price | List to Sale | Price per Sq Ft |
|---|---|---|---|---|
| 09/13/2023 09/13/23 | Rented | $3,000 | 0.0% | -- |
| 08/31/2023 08/31/23 | For Rent | $3,000 | +50.0% | -- |
| 03/29/2016 03/29/16 | Rented | $2,000 | 0.0% | -- |
| 03/29/2016 03/29/16 | Under Contract | -- | -- | -- |
| 02/06/2016 02/06/16 | For Rent | $2,000 | 0.0% | -- |
| 09/11/2013 09/11/13 | Rented | $2,000 | -4.8% | -- |
| 09/11/2013 09/11/13 | Under Contract | -- | -- | -- |
| 08/17/2013 08/17/13 | For Rent | $2,100 | -- | -- |
| Year | Tax Paid | Tax Assessment Tax Assessment Total Assessment is a certain percentage of the fair market value that is determined by local assessors to be the total taxable value of land and additions on the property. | Land | Improvement |
|---|---|---|---|---|
| 2025 | $5,632 | $528,320 | $195,000 | $333,320 |
| 2023 | $5,304 | $469,970 | $175,000 | $294,970 |
| 2022 | $5,115 | $447,350 | $160,000 | $287,350 |
| 2021 | $4,936 | $420,640 | $145,000 | $275,640 |
| 2020 | $4,510 | $381,060 | $120,000 | $261,060 |
| 2019 | $4,391 | $371,060 | $110,000 | $261,060 |
| 2018 | $4,208 | $365,940 | $110,000 | $255,940 |
| 2017 | $4,046 | $348,530 | $105,000 | $243,530 |
| 2016 | $3,909 | $337,460 | $105,000 | $232,460 |
Landlord's Agent in 2023
Ann Malcolm
Malcolm Real Estate, Inc.
(202) 333-8500
7 Total Sales
Tenant's Agent in 2023
Adrien Henric
Weichert Corporate
(571) 232-3683
11 Total Sales
Seller Co-Listing Agent in 2016
Susan Hottman
Malcolm Real Estate, Inc.
(703) 967-6403
6 Total Sales
K
Buyer's Agent in 2016
Kelly Sutherland
Prudential PenFed
Source: Bright MLS
MLS Number: VAFX2144094
APN: 0982-08-0150
Disclaimer: Certain information contained herein is derived from information provided by parties other than Homes.com. All information provided is deemed reliable, but is not guaranteed to be accurate and should be independently verified.
![]() The data relating to real estate for sale on this website appears in part through the BRIGHT Internet Data Exchange program, a voluntary cooperative exchange of property listing data between licensed real estate brokerage firms, and is provided by BRIGHT through a licensing agreement.
The data relating to real estate for sale on this website appears in part through the BRIGHT Internet Data Exchange program, a voluntary cooperative exchange of property listing data between licensed real estate brokerage firms, and is provided by BRIGHT through a licensing agreement.
Listing information is from various brokers who participate in the Bright MLS IDX program and not all listings may be visible on the site.
The property information being provided on or through the website is for the personal, non-commercial use of consumers and such information may not be used for any purpose other than to identify prospective properties consumers may be interested in purchasing.
Some properties which appear for sale on the website may no longer be available because they are for instance, under contract, sold or are no longer being offered for sale.
Property information displayed is deemed reliable but is not guaranteed.
Copyright 2026 Bright MLS, Inc.
Ask me questions while you tour the home.