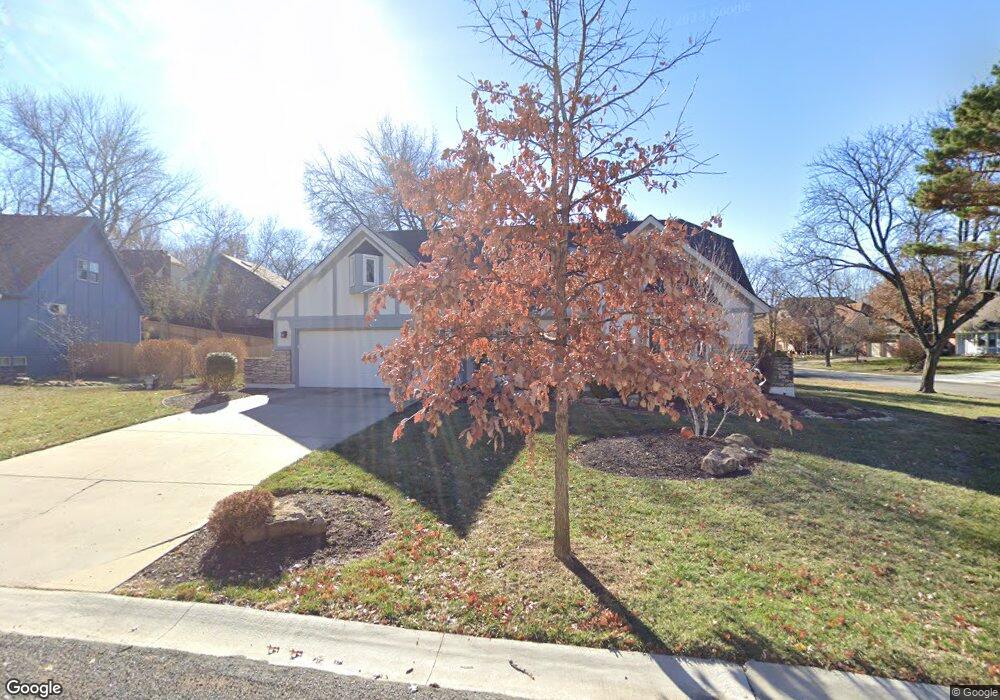
8029 W 113th St Overland Park, KS 66210
Central Overland Park NeighborhoodEstimated Value: $485,639 - $525,000
4
Beds
3
Baths
2,539
Sq Ft
$201/Sq Ft
Est. Value
About This Home
This home is located at 8029 W 113th St, Overland Park, KS 66210 and is currently estimated at $511,410, approximately $201 per square foot. 8029 W 113th St is a home located in Johnson County with nearby schools including Valley Park Elementary School, Overland Trail Middle School, and Blue Valley North High School.
Ownership History
Date
Name
Owned For
Owner Type
Purchase Details
Closed on
Nov 19, 2010
Sold by
Corwin Paul L and Corwin Sandra M
Bought by
Corwin Paul L and Corwin Sandra M
Current Estimated Value
Home Financials for this Owner
Home Financials are based on the most recent Mortgage that was taken out on this home.
Original Mortgage
$153,000
Outstanding Balance
$100,431
Interest Rate
4.17%
Mortgage Type
New Conventional
Estimated Equity
$410,979
Purchase Details
Closed on
Mar 14, 2007
Sold by
Corwin Paul L and Corwin Sandra M
Bought by
Corwin Paul L and Corwin Sandra M
Purchase Details
Closed on
Feb 13, 2001
Sold by
Palipchak Sandra M
Bought by
Corwin Paul L and Corwin Sandra M
Home Financials for this Owner
Home Financials are based on the most recent Mortgage that was taken out on this home.
Original Mortgage
$165,000
Interest Rate
7.04%
Create a Home Valuation Report for This Property
The Home Valuation Report is an in-depth analysis detailing your home's value as well as a comparison with similar homes in the area
Home Values in the Area
Average Home Value in this Area
Purchase History
| Date | Buyer | Sale Price | Title Company |
|---|---|---|---|
| Corwin Paul L | -- | Platinum Title Llc | |
| Corwin Paul L | -- | Platinum Title Llc | |
| Corwin Paul L | -- | None Available | |
| Corwin Paul L | -- | Security Land Title Company |
Source: Public Records
Mortgage History
| Date | Status | Borrower | Loan Amount |
|---|---|---|---|
| Open | Corwin Paul L | $153,000 | |
| Closed | Corwin Paul L | $165,000 |
Source: Public Records
Tax History Compared to Growth
Tax History
| Year | Tax Paid | Tax Assessment Tax Assessment Total Assessment is a certain percentage of the fair market value that is determined by local assessors to be the total taxable value of land and additions on the property. | Land | Improvement |
|---|---|---|---|---|
| 2024 | $5,274 | $51,613 | $11,650 | $39,963 |
| 2023 | $5,194 | $49,911 | $11,650 | $38,261 |
| 2022 | $4,865 | $45,920 | $11,650 | $34,270 |
| 2021 | $4,959 | $44,390 | $10,123 | $34,267 |
| 2020 | $4,768 | $42,400 | $8,803 | $33,597 |
| 2019 | $4,729 | $41,159 | $5,870 | $35,289 |
| 2018 | $4,409 | $37,617 | $5,870 | $31,747 |
| 2017 | $4,287 | $35,938 | $5,870 | $30,068 |
| 2016 | $3,916 | $32,810 | $5,870 | $26,940 |
| 2015 | $3,835 | $32,005 | $5,870 | $26,135 |
| 2013 | -- | $28,681 | $5,870 | $22,811 |
Source: Public Records
Map
Nearby Homes
- 11316 Hemlock St
- 8500 W 113th St
- 11447 Craig St
- 11309 Riley St
- 11200 Marty St
- 11504 Newton St
- 8028 W 116th St
- 11321 Slater St
- 8635 W 109th St
- 8607 W 108 Place
- 11163 Eby St
- 9013 W 115th St
- 11721 Craig St
- 9108 W 113th St
- 11404 Grandview Dr
- 7861 W 118th Terrace
- 11838 Mackey St
- 8819 W 106th Terrace
- 8858 W 106th Terrace
- 12031 Hemlock St
- 8027 W 113th St
- 8216 W 113th Terrace
- 8212 W 113th Terrace
- 8030 W 113th St
- 11304 Hemlock St
- 11300 Hemlock St
- 11308 Hemlock St
- 8023 W 113th St
- 11298 Hemlock St
- 8206 W 113th Terrace
- 8026 W 113th St
- 11312 Hemlock St
- 11294 Hemlock St
- 8204 W 113th Terrace
- 11293 Hemlock St
- 11315 Hemlock St
- 8019 W 113th St
- 11297 Hadley St
- 11295 Hadley St
- 8223 W 113th Terrace