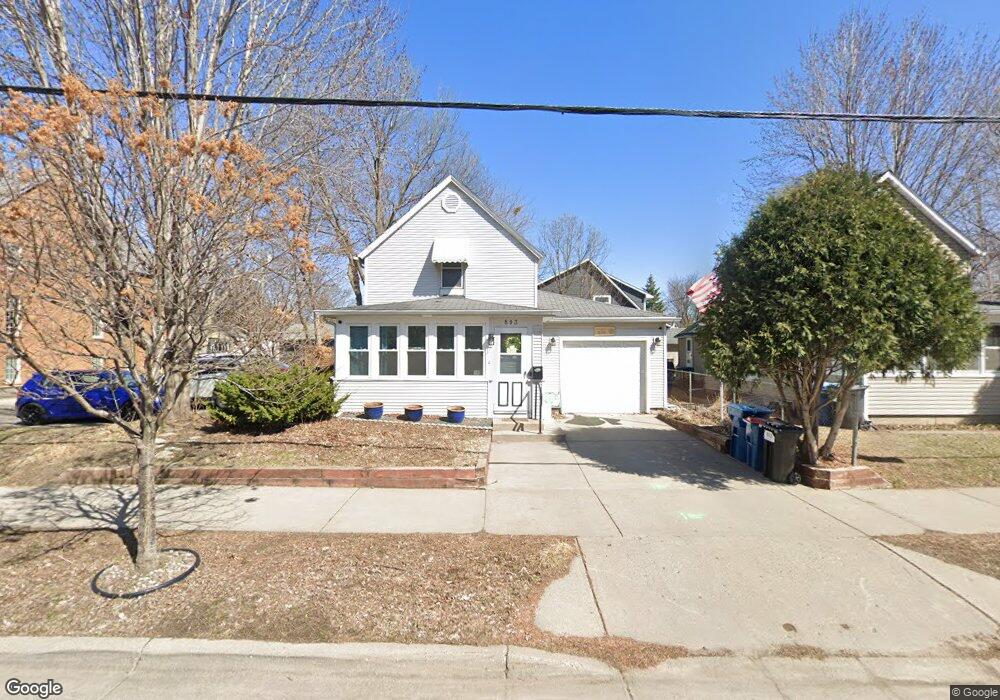
803 2nd St N Hopkins, MN 55343
Estimated Value: $329,000 - $364,521
2
Beds
2
Baths
948
Sq Ft
$369/Sq Ft
Est. Value
About This Home
This home is located at 803 2nd St N, Hopkins, MN 55343 and is currently estimated at $349,880, approximately $369 per square foot. 803 2nd St N is a home located in Hennepin County with nearby schools including Alice Smith Elementary School, Hopkins North Junior High School, and Hopkins Senior High School.
Ownership History
Date
Name
Owned For
Owner Type
Purchase Details
Closed on
Aug 22, 2018
Sold by
Brummund Samuel C and Brummund Abby A
Bought by
Livingston Michelle R and Livingston Michelle
Current Estimated Value
Home Financials for this Owner
Home Financials are based on the most recent Mortgage that was taken out on this home.
Original Mortgage
$220,000
Outstanding Balance
$191,061
Interest Rate
4.5%
Mortgage Type
VA
Estimated Equity
$158,819
Purchase Details
Closed on
Jan 7, 2013
Sold by
Nielsen Carolun Sue and Nielsen Paul H
Bought by
Brummund Samuel C and Brummund Abby A
Home Financials for this Owner
Home Financials are based on the most recent Mortgage that was taken out on this home.
Original Mortgage
$108,000
Interest Rate
3.3%
Mortgage Type
New Conventional
Create a Home Valuation Report for This Property
The Home Valuation Report is an in-depth analysis detailing your home's value as well as a comparison with similar homes in the area
Home Values in the Area
Average Home Value in this Area
Purchase History
| Date | Buyer | Sale Price | Title Company |
|---|---|---|---|
| Livingston Michelle R | $220,000 | None Available | |
| Brummund Samuel C | -- | Edina Realty Title |
Source: Public Records
Mortgage History
| Date | Status | Borrower | Loan Amount |
|---|---|---|---|
| Open | Livingston Michelle R | $220,000 | |
| Previous Owner | Brummund Samuel C | $108,000 |
Source: Public Records
Tax History Compared to Growth
Tax History
| Year | Tax Paid | Tax Assessment Tax Assessment Total Assessment is a certain percentage of the fair market value that is determined by local assessors to be the total taxable value of land and additions on the property. | Land | Improvement |
|---|---|---|---|---|
| 2024 | $2,630 | $327,400 | $153,900 | $173,500 |
| 2023 | $2,140 | $298,000 | $134,300 | $163,700 |
| 2022 | $3,819 | $289,000 | $128,000 | $161,000 |
| 2021 | $3,562 | $259,000 | $125,000 | $134,000 |
| 2020 | $3,632 | $243,000 | $115,000 | $128,000 |
| 2019 | $2,797 | $223,000 | $108,000 | $115,000 |
| 2018 | $2,688 | $188,000 | $98,000 | $90,000 |
| 2017 | $2,274 | $160,000 | $81,000 | $79,000 |
| 2016 | $2,232 | $153,000 | $76,000 | $77,000 |
| 2015 | $2,313 | $158,000 | $81,000 | $77,000 |
| 2014 | -- | $134,000 | $66,000 | $68,000 |
Source: Public Records
Map
Nearby Homes
- 334 9th Ave N
- 228 12th Ave N
- 101 5th Ave N
- 750 Mainstreet Unit 430
- 750 Mainstreet Unit 422
- 750 Mainstreet Unit 210
- 32 11th Ave S Unit 204
- 32 11th Ave S Unit 305
- 32 11th Ave S Unit 303
- 504 Oak Ridge Place
- 17 15th Ave N
- 329 & 327 16th Ave N
- 102 16th Ave N
- 1502 5th St N Unit 403
- 1502 5th St N Unit 211
- 37 19th Ave N
- 3720 Independence Ave S Unit 90
- 3680 Independence Ave S Unit 83
- 130 17th Ave S
- 502 Shadyside Cir