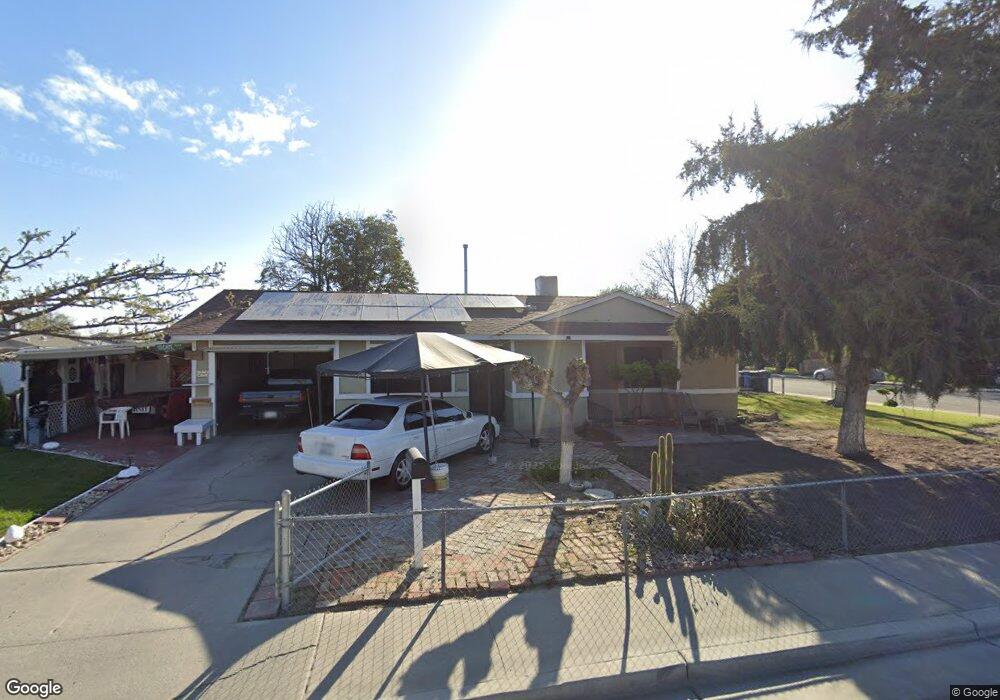
803 6 1/2 Ave Corcoran, CA 93212
Estimated Value: $252,662 - $269,000
3
Beds
2
Baths
1,047
Sq Ft
$247/Sq Ft
Est. Value
About This Home
This home is located at 803 6 1/2 Ave, Corcoran, CA 93212 and is currently estimated at $258,666, approximately $247 per square foot. 803 6 1/2 Ave is a home located in Kings County with nearby schools including John C. Fremont Elementary School, Bret Harte Elementary School, and Mark Twain Elementary School.
Ownership History
Date
Name
Owned For
Owner Type
Purchase Details
Closed on
Aug 29, 2019
Sold by
Raymond Sandoval
Bought by
Valdez Eva and Cato Norma
Current Estimated Value
Purchase Details
Closed on
Feb 28, 2019
Sold by
Unknown
Bought by
Sandoval Raymond
Purchase Details
Closed on
Dec 5, 2018
Sold by
Lewis Elisa and Sandoval Elisa
Bought by
Sandoval Raymond
Purchase Details
Closed on
Nov 26, 2018
Sold by
Eva Valdez
Bought by
Sandoval Raymond
Purchase Details
Closed on
Nov 17, 2018
Sold by
Cato Norma
Bought by
Sandoval Raymond
Purchase Details
Closed on
Jun 30, 2008
Sold by
Sandoval Marcos
Bought by
Sandoval Eleanor and Lewis Elisa
Purchase Details
Closed on
Oct 18, 1999
Sold by
Sandoval Eleanor and Lewis Elisa
Bought by
Sandoval Eleanor and Lewis Elisa
Create a Home Valuation Report for This Property
The Home Valuation Report is an in-depth analysis detailing your home's value as well as a comparison with similar homes in the area
Home Values in the Area
Average Home Value in this Area
Purchase History
| Date | Buyer | Sale Price | Title Company |
|---|---|---|---|
| Valdez Eva | -- | None Listed On Document | |
| Sandoval Raymond | -- | None Listed On Document | |
| Sandoval Raymond | -- | None Listed On Document | |
| Sandoval Raymond | -- | None Available | |
| Sandoval Raymond | -- | None Listed On Document | |
| Sandoval Raymond | -- | None Available | |
| Sandoval Eleanor | -- | None Available | |
| Sandoval Eleanor | -- | -- |
Source: Public Records
Tax History Compared to Growth
Tax History
| Year | Tax Paid | Tax Assessment Tax Assessment Total Assessment is a certain percentage of the fair market value that is determined by local assessors to be the total taxable value of land and additions on the property. | Land | Improvement |
|---|---|---|---|---|
| 2025 | $1,235 | $126,064 | $35,689 | $90,375 |
| 2023 | $1,235 | $121,170 | $34,304 | $86,866 |
| 2022 | $1,192 | $118,795 | $33,632 | $85,163 |
| 2021 | $1,167 | $116,467 | $32,973 | $83,494 |
| 2020 | $1,149 | $115,273 | $32,635 | $82,638 |
| 2019 | $723 | $50,484 | $9,776 | $40,708 |
| 2018 | $640 | $49,494 | $9,584 | $39,910 |
| 2017 | $628 | $48,523 | $9,396 | $39,127 |
| 2016 | $439 | $47,572 | $9,212 | $38,360 |
| 2015 | $437 | $46,858 | $9,074 | $37,784 |
| 2014 | $428 | $45,940 | $8,896 | $37,044 |
Source: Public Records
Map
Nearby Homes
- 2430 Lorina Ave
- 2710 Brokaw Ave
- 2314 Lorina Ave
- #12 Corral St
- 2201 Lorina Ave
- Monroe Plan at Fox Run
- Ponderosa Plan at Fox Run
- Lincoln Plan at Fox Run
- Adams Plan at Fox Run
- Coolidge Plan at Fox Run
- 717 James Ave Unit 43 Fr
- #43 James Ave
- 2808 Hanna Ave
- 446 6 1 2 Ave
- 9999 Branum & Olympic Ave
- 504 Benrus Ave
- 0 Patterson Ave
- 99 Patterson Ave
- 2217 Gable Ave
- 1901 Patterson Ave
- 2426 Strepy Ave
- 801 6 1 2 Ave
- 801 6 1/2 Ave
- 2427 Patterson Ave
- 2422 Strepy Ave
- 2418 Strepy Ave
- 2427 Strepy Ave
- 810 6 1/2 Ave
- 2423 Patterson Ave
- 1500 W Patterson
- 820 6 1/2 Ave
- 900 Regency Ave
- 0 W Patterson Unit 120830
- 0 W Patterson Unit 120820
- 0 W Patterson Unit 125213
- 0 W Patterson Unit 125212
- 0 W Patterson Unit 125211
- 0 W Patterson Unit 125210
- 0 W Patterson Unit 129022
- 0 W Patterson Unit 129019