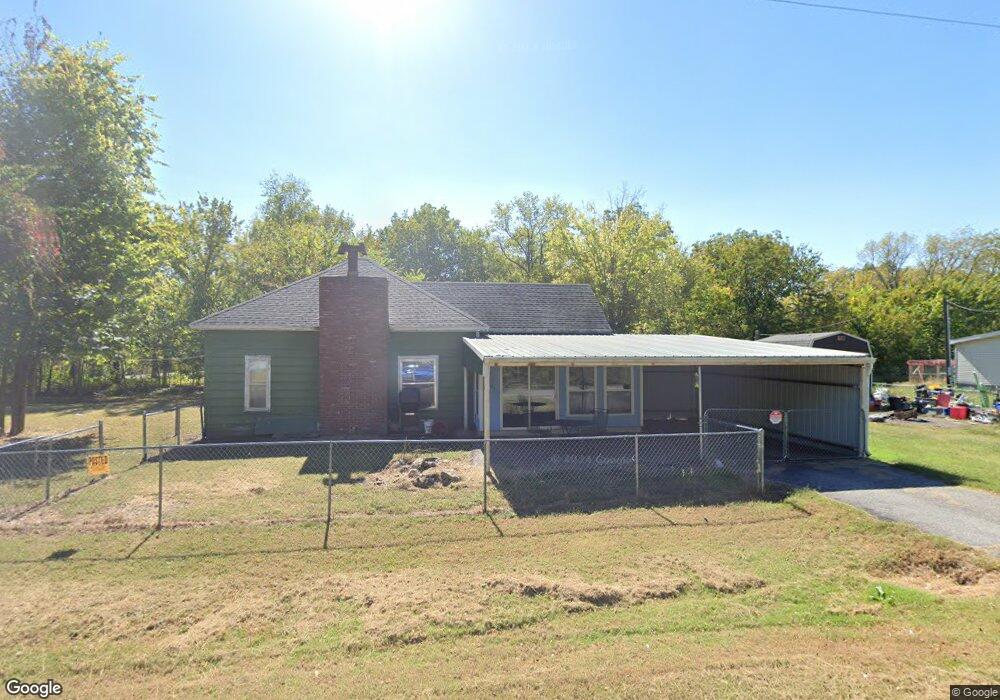
803 7th St Mc Cune, KS 66753
Estimated Value: $59,339 - $118,000
3
Beds
1
Bath
1,000
Sq Ft
$86/Sq Ft
Est. Value
About This Home
This home is located at 803 7th St, Mc Cune, KS 66753 and is currently estimated at $85,585, approximately $85 per square foot. 803 7th St is a home located in Crawford County with nearby schools including Southeast High School.
Ownership History
Date
Name
Owned For
Owner Type
Purchase Details
Closed on
Sep 1, 2005
Bought by
Deatherage Yong C and Deatherage Danny L
Current Estimated Value
Create a Home Valuation Report for This Property
The Home Valuation Report is an in-depth analysis detailing your home's value as well as a comparison with similar homes in the area
Purchase History
| Date | Buyer | Sale Price | Title Company |
|---|---|---|---|
| Deatherage Yong C | $35,000 | -- |
Source: Public Records
Tax History
| Year | Tax Paid | Tax Assessment Tax Assessment Total Assessment is a certain percentage of the fair market value that is determined by local assessors to be the total taxable value of land and additions on the property. | Land | Improvement |
|---|---|---|---|---|
| 2025 | $595 | $4,377 | $214 | $4,163 |
| 2024 | $559 | $4,091 | $214 | $3,877 |
| 2023 | $497 | $3,719 | $398 | $3,321 |
| 2022 | $478 | $3,519 | $332 | $3,187 |
| 2021 | $487 | $3,340 | $332 | $3,008 |
| 2020 | $498 | $3,341 | $321 | $3,020 |
| 2019 | $501 | $3,341 | $321 | $3,020 |
| 2018 | $458 | $3,128 | $321 | $2,807 |
| 2017 | $500 | $3,128 | $321 | $2,807 |
| 2016 | $500 | $3,128 | $321 | $2,807 |
| 2015 | $477 | $3,128 | $307 | $2,821 |
| 2014 | $477 | $3,105 | $307 | $2,798 |
Source: Public Records
Map
Nearby Homes
- 511 3rd St
- 2555 22000th Rd
- 112 Janett St
- 202 Cullen Ave
- 00000 S 120th St
- 20Th Rd
- 22155 70th Rd
- 705 W Magnolia St
- 000 E 530th Ave
- 18794 McKinley Lake Rd
- 502 W Magnolia St
- 0 60th Rd Unit HMS2538487
- 3970 NW Lawton Rd
- 1734 24000 Rd
- 00 Valley Rd
- 0 Valley Rd Unit HMS2598483
- 1702 Cedar Ridge Rd
- 1700 Cedar Ridge Rd
- 321 Kay Ln
- 17040 Saline Rd