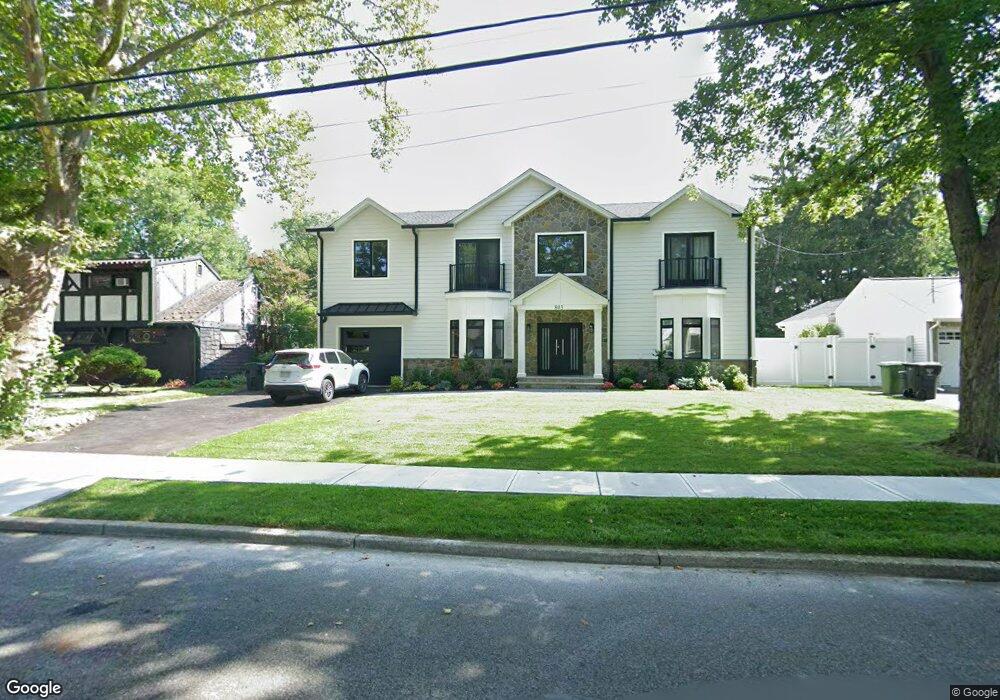
803 Arbor Rd Paramus, NJ 07652
Estimated Value: $1,718,773 - $2,138,000
Studio
--
Bath
3,744
Sq Ft
$526/Sq Ft
Est. Value
About This Home
This home is located at 803 Arbor Rd, Paramus, NJ 07652 and is currently estimated at $1,969,693, approximately $526 per square foot. 803 Arbor Rd is a home located in Bergen County with nearby schools including Paramus High School and Bergen Catholic High School.
Ownership History
Date
Name
Owned For
Owner Type
Purchase Details
Closed on
Oct 12, 2016
Sold by
Sinclair Edward
Bought by
Sinclair Edward and Zachar Jean
Current Estimated Value
Purchase Details
Closed on
Jul 18, 2016
Sold by
Martinez Carmen and Martinez Ricardo
Bought by
Santos Jessyca G
Home Financials for this Owner
Home Financials are based on the most recent Mortgage that was taken out on this home.
Original Mortgage
$481,124
Outstanding Balance
$384,577
Interest Rate
3.62%
Mortgage Type
FHA
Estimated Equity
$1,585,116
Create a Home Valuation Report for This Property
The Home Valuation Report is an in-depth analysis detailing your home's value as well as a comparison with similar homes in the area
Home Values in the Area
Average Home Value in this Area
Purchase History
| Date | Buyer | Sale Price | Title Company |
|---|---|---|---|
| Sinclair Edward | -- | Attorney | |
| Santos Jessyca G | $495,000 | Title Insurance Commitment |
Source: Public Records
Mortgage History
| Date | Status | Borrower | Loan Amount |
|---|---|---|---|
| Open | Santos Jessyca G | $481,124 |
Source: Public Records
Tax History
| Year | Tax Paid | Tax Assessment Tax Assessment Total Assessment is a certain percentage of the fair market value that is determined by local assessors to be the total taxable value of land and additions on the property. | Land | Improvement |
|---|---|---|---|---|
| 2025 | $20,819 | $1,459,200 | $402,000 | $1,057,200 |
| 2024 | $20,220 | $1,375,100 | $372,700 | $1,002,400 |
| 2023 | $19,164 | $1,318,100 | $355,500 | $962,600 |
| 2022 | $10,240 | $659,800 | $332,300 | $327,500 |
| 2021 | $9,997 | $604,400 | $303,000 | $301,400 |
| 2020 | $9,415 | $590,300 | $293,000 | $297,300 |
| 2019 | $7,539 | $406,200 | $264,000 | $142,200 |
| 2018 | $7,446 | $406,200 | $264,000 | $142,200 |
| 2017 | $7,316 | $406,200 | $264,000 | $142,200 |
| 2016 | $7,117 | $406,200 | $264,000 | $142,200 |
| 2015 | $7,044 | $406,200 | $264,000 | $142,200 |
| 2014 | $6,983 | $406,200 | $264,000 | $142,200 |
Source: Public Records
Map
Nearby Homes
- 743 Boyd Rd
- 828 Pascack Rd
- 780 Hilton Place
- 141 Pond Dr Unit 14A
- 672 Rutgers Place
- 801 Godwin Rd
- 645 Cambridge Rd
- 1153 Linwood Ave
- 229 Standish Rd
- 65 Edgewood Dr
- 82 Azalea St
- 86 Azalea St
- 692 Pine Lake Dr
- 648 Falmouth Ave
- 704 Evans St
- 623 Alberta Dr
- 286 Ridgewood Blvd N
- 199 Honeysuckle Dr
- 319 Franklin Place
- 624 West Dr
Your Personal Tour Guide
Ask me questions while you tour the home.