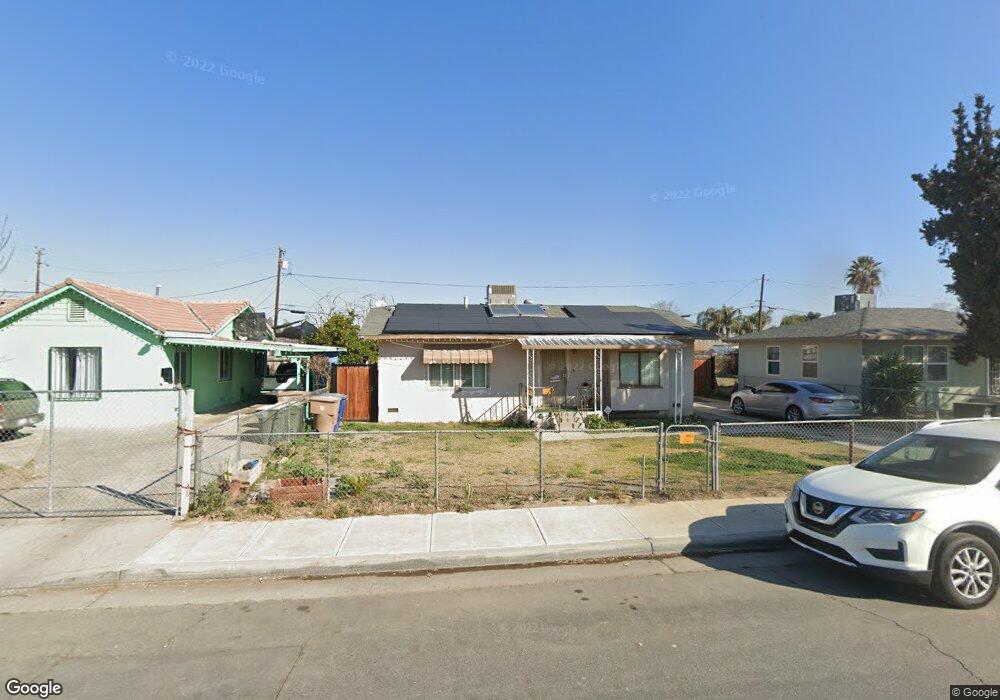
803 Casino St Bakersfield, CA 93307
Estimated Value: $189,000 - $245,000
2
Beds
1
Bath
976
Sq Ft
$221/Sq Ft
Est. Value
About This Home
This home is located at 803 Casino St, Bakersfield, CA 93307 and is currently estimated at $215,911, approximately $221 per square foot. 803 Casino St is a home located in Kern County with nearby schools including Casa Loma Elementary School, Sequoia Middle School, and Mira Monte High School.
Ownership History
Date
Name
Owned For
Owner Type
Purchase Details
Closed on
Mar 14, 2017
Sold by
Navarrette Barajas Fred and Navarrette Barajas Consuela
Bought by
Barajas Connie
Current Estimated Value
Purchase Details
Closed on
Apr 9, 2001
Sold by
Stanley Mildred E
Bought by
Barajas Federico and Barajas Consuela
Home Financials for this Owner
Home Financials are based on the most recent Mortgage that was taken out on this home.
Original Mortgage
$46,583
Interest Rate
7.03%
Mortgage Type
FHA
Create a Home Valuation Report for This Property
The Home Valuation Report is an in-depth analysis detailing your home's value as well as a comparison with similar homes in the area
Home Values in the Area
Average Home Value in this Area
Purchase History
| Date | Buyer | Sale Price | Title Company |
|---|---|---|---|
| Barajas Connie | -- | None Available | |
| Navarrette Barajas Fred | -- | None Available | |
| Barajas Federico | $47,000 | Stewart Title |
Source: Public Records
Mortgage History
| Date | Status | Borrower | Loan Amount |
|---|---|---|---|
| Previous Owner | Barajas Federico | $46,583 |
Source: Public Records
Tax History Compared to Growth
Tax History
| Year | Tax Paid | Tax Assessment Tax Assessment Total Assessment is a certain percentage of the fair market value that is determined by local assessors to be the total taxable value of land and additions on the property. | Land | Improvement |
|---|---|---|---|---|
| 2025 | $1,524 | $70,796 | $9,027 | $61,769 |
| 2024 | $1,486 | $69,408 | $8,850 | $60,558 |
| 2023 | $1,486 | $68,048 | $8,677 | $59,371 |
| 2022 | $1,438 | $66,714 | $8,507 | $58,207 |
| 2021 | $1,340 | $65,407 | $8,341 | $57,066 |
| 2020 | $1,305 | $64,737 | $8,256 | $56,481 |
| 2019 | $1,281 | $64,737 | $8,256 | $56,481 |
| 2018 | $1,254 | $62,226 | $7,937 | $54,289 |
| 2017 | $1,245 | $61,007 | $7,782 | $53,225 |
| 2016 | $1,165 | $59,812 | $7,630 | $52,182 |
| 2015 | $1,153 | $58,915 | $7,516 | $51,399 |
| 2014 | $1,117 | $57,762 | $7,369 | $50,393 |
Source: Public Records
Map
Nearby Homes