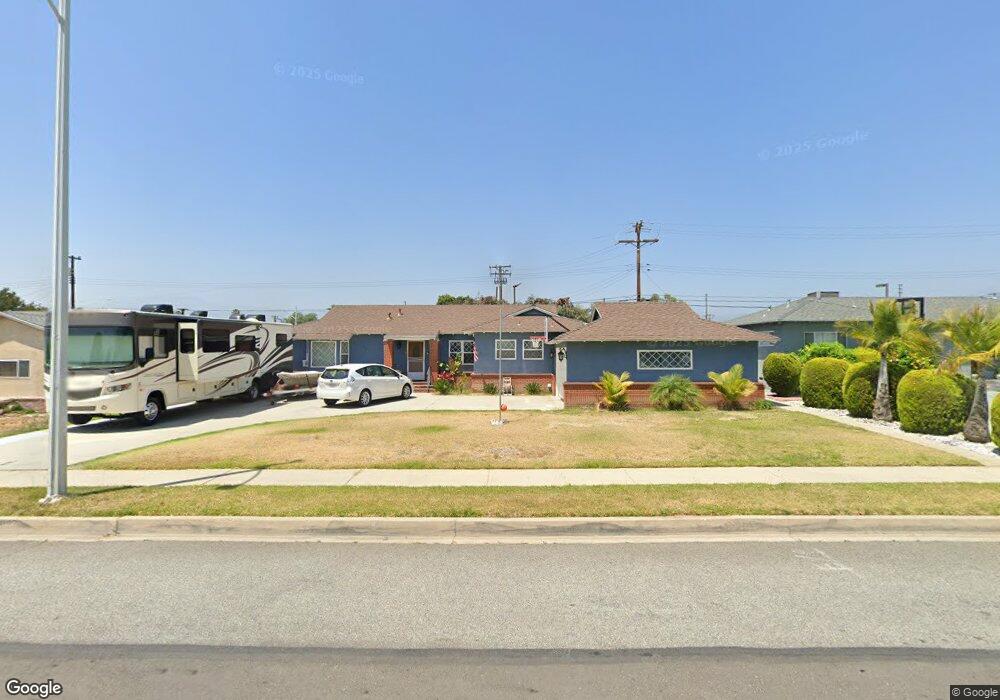
803 E Marilyn Way Covina, CA 91722
Estimated Value: $807,000 - $874,000
3
Beds
2
Baths
1,848
Sq Ft
$448/Sq Ft
Est. Value
About This Home
This home is located at 803 E Marilyn Way, Covina, CA 91722 and is currently estimated at $827,863, approximately $447 per square foot. 803 E Marilyn Way is a home located in Los Angeles County with nearby schools including Ben Lomond Elementary School, South Hills High School, and Sonrise Christian.
Ownership History
Date
Name
Owned For
Owner Type
Purchase Details
Closed on
Sep 11, 2018
Sold by
Ratzlaff Cheri
Bought by
Ratzlaff John R
Current Estimated Value
Home Financials for this Owner
Home Financials are based on the most recent Mortgage that was taken out on this home.
Original Mortgage
$100,000
Interest Rate
4.5%
Mortgage Type
New Conventional
Purchase Details
Closed on
Sep 7, 2018
Sold by
Ratzlaff John R
Bought by
Ratzlaff John R and Ratzlaff John R
Home Financials for this Owner
Home Financials are based on the most recent Mortgage that was taken out on this home.
Original Mortgage
$100,000
Interest Rate
4.5%
Mortgage Type
New Conventional
Purchase Details
Closed on
Jul 28, 2009
Sold by
Ratzlaff Dorothy E
Bought by
The D E Ratzlaff Trust
Purchase Details
Closed on
Feb 6, 2003
Sold by
Ratzlaff Dorothy E
Bought by
Ratzlaff Dorothy E
Create a Home Valuation Report for This Property
The Home Valuation Report is an in-depth analysis detailing your home's value as well as a comparison with similar homes in the area
Home Values in the Area
Average Home Value in this Area
Purchase History
| Date | Buyer | Sale Price | Title Company |
|---|---|---|---|
| Ratzlaff John R | -- | Chicago Title Company | |
| Ratzlaff John R | -- | Chicago Title Company | |
| Ratzlaff John R | -- | Chicago Title Company | |
| The D E Ratzlaff Trust | -- | None Available | |
| Ratzlaff Dorothy E | -- | -- |
Source: Public Records
Mortgage History
| Date | Status | Borrower | Loan Amount |
|---|---|---|---|
| Closed | Ratzlaff John R | $100,000 | |
| Closed | Ratzlaff John R | $100,000 |
Source: Public Records
Tax History
| Year | Tax Paid | Tax Assessment Tax Assessment Total Assessment is a certain percentage of the fair market value that is determined by local assessors to be the total taxable value of land and additions on the property. | Land | Improvement |
|---|---|---|---|---|
| 2025 | $2,723 | $183,356 | $94,404 | $88,952 |
| 2024 | $2,723 | $179,761 | $92,553 | $87,208 |
| 2023 | $2,686 | $176,238 | $90,739 | $85,499 |
| 2022 | $2,652 | $172,783 | $88,960 | $83,823 |
| 2021 | $2,607 | $169,396 | $87,216 | $82,180 |
| 2019 | $2,553 | $164,374 | $84,630 | $79,744 |
| 2018 | $2,362 | $161,152 | $82,971 | $78,181 |
| 2016 | $2,223 | $154,897 | $79,750 | $75,147 |
| 2015 | $2,163 | $152,572 | $78,553 | $74,019 |
| 2014 | $2,142 | $149,585 | $77,015 | $72,570 |
Source: Public Records
Map
Nearby Homes
- 19555 E Cypress St Unit P
- 19548 E Cypress St Unit 3
- 19548 E Cypress St Unit 17
- 19548 E Cypress St
- 19548 E Cypress St Unit 33
- 565 E Benbow St
- 905 N Bender Ave
- 4900 N Grand Ave Unit 130
- 4900 N Grand Ave Unit 215
- 4900 N Grand Ave Unit 212
- 4900 N Grand Ave Unit 322
- 4900 N Grand Ave Unit 206
- 523 E Covina Blvd
- 716 N Grand Ave Unit E2
- 716 N Grand Ave Unit D7
- 716 N Grand Ave Unit I-5
- 716 N Grand Ave Unit H3
- 716 N Grand Ave Unit A8
- 716 N Grand Ave Unit A-7
- 424 Lemonade Place
- 811 E Marilyn Way
- 787 E Marilyn Way
- 774 E Bickley Dr
- 823 E Marilyn Way
- 767 E Marilyn Way
- 802 E Marilyn Way
- 768 E Bickley Dr
- 780 E Marilyn Way
- 810 E Marilyn Way
- 820 E Marilyn Way
- 768 E Marilyn Way
- 759 E Marilyn Way
- 831 E Marilyn Way
- 760 E Bickley Dr
- 775 E Bickley Dr
- 803 E Benbow St
- 781 E Benbow St
- 813 E Benbow St
- 758 E Marilyn Way
- 832 E Marilyn Way
Your Personal Tour Guide
Ask me questions while you tour the home.