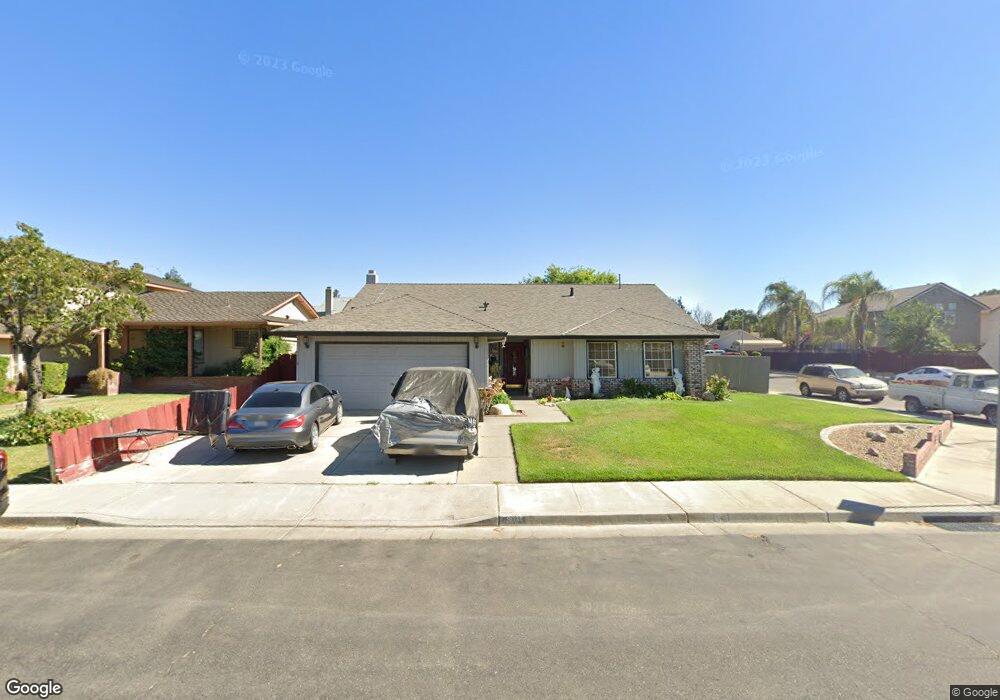
803 Foothill Ct Los Banos, CA 93635
Estimated Value: $453,000 - $513,000
4
Beds
2
Baths
1,859
Sq Ft
$262/Sq Ft
Est. Value
About This Home
This home is located at 803 Foothill Ct, Los Banos, CA 93635 and is currently estimated at $487,221, approximately $262 per square foot. 803 Foothill Ct is a home located in Merced County with nearby schools including Los Banos Elementary School, Creekside Junior High School, and Los Banos High School.
Ownership History
Date
Name
Owned For
Owner Type
Purchase Details
Closed on
Aug 24, 2005
Sold by
Perkins Terry D and Perkins Emily
Bought by
Perkins Terry D and Perkins Emily
Current Estimated Value
Home Financials for this Owner
Home Financials are based on the most recent Mortgage that was taken out on this home.
Original Mortgage
$338,000
Outstanding Balance
$177,328
Interest Rate
5.64%
Mortgage Type
Stand Alone Refi Refinance Of Original Loan
Estimated Equity
$309,893
Purchase Details
Closed on
Jan 21, 1999
Sold by
Lindemann Patrick Michael
Bought by
Perkins Terry D and Perkins Emily
Home Financials for this Owner
Home Financials are based on the most recent Mortgage that was taken out on this home.
Original Mortgage
$129,600
Interest Rate
10.25%
Mortgage Type
Purchase Money Mortgage
Purchase Details
Closed on
Jun 30, 1997
Sold by
Glenn Cleveland & Judy
Bought by
Lindemann Patrick Michael and Lindemann Cathy T
Home Financials for this Owner
Home Financials are based on the most recent Mortgage that was taken out on this home.
Original Mortgage
$122,400
Interest Rate
7.61%
Mortgage Type
Purchase Money Mortgage
Create a Home Valuation Report for This Property
The Home Valuation Report is an in-depth analysis detailing your home's value as well as a comparison with similar homes in the area
Home Values in the Area
Average Home Value in this Area
Purchase History
| Date | Buyer | Sale Price | Title Company |
|---|---|---|---|
| Perkins Terry D | -- | Financial Title Company | |
| Perkins Terry D | $144,000 | Chicago Title Co | |
| Lindemann Patrick Michael | $144,000 | Fidelity National Title Co |
Source: Public Records
Mortgage History
| Date | Status | Borrower | Loan Amount |
|---|---|---|---|
| Open | Perkins Terry D | $338,000 | |
| Closed | Perkins Terry D | $129,600 | |
| Previous Owner | Lindemann Patrick Michael | $122,400 | |
| Closed | Perkins Terry D | $14,400 |
Source: Public Records
Tax History Compared to Growth
Tax History
| Year | Tax Paid | Tax Assessment Tax Assessment Total Assessment is a certain percentage of the fair market value that is determined by local assessors to be the total taxable value of land and additions on the property. | Land | Improvement |
|---|---|---|---|---|
| 2025 | $2,699 | $225,727 | $47,020 | $178,707 |
| 2024 | $2,699 | $221,302 | $46,099 | $175,203 |
| 2023 | $2,539 | $216,964 | $45,196 | $171,768 |
| 2022 | $2,480 | $212,710 | $44,310 | $168,400 |
| 2021 | $5,563 | $208,541 | $43,442 | $165,099 |
| 2020 | $5,482 | $206,404 | $42,997 | $163,407 |
| 2019 | $5,436 | $202,357 | $42,154 | $160,203 |
| 2018 | $5,359 | $198,390 | $41,328 | $157,062 |
| 2017 | $5,309 | $194,501 | $40,518 | $153,983 |
| 2016 | $2,276 | $190,688 | $39,724 | $150,964 |
| 2015 | $2,232 | $187,825 | $39,128 | $148,697 |
| 2014 | $2,174 | $184,147 | $38,362 | $145,785 |
Source: Public Records
Map
Nearby Homes
- 807 Foothill Ct
- 802 Mckinley St
- 811 Foothill Ct
- 731 Foothill St
- 808 Foothill Ct
- 732 Mckinley St
- 810 Mckinley St
- 804 Foothill Ct
- 812 Foothill Ct
- 815 Foothill Ct
- 727 Foothill St
- 730 Foothill St
- 816 Foothill Ct
- 814 Mckinley St
- 726 Foothill St
- 819 Foothill Ct
- 820 Foothill Ct
- 723 Foothill St
- 813 Coastal Ct
- 809 Coastal Ct