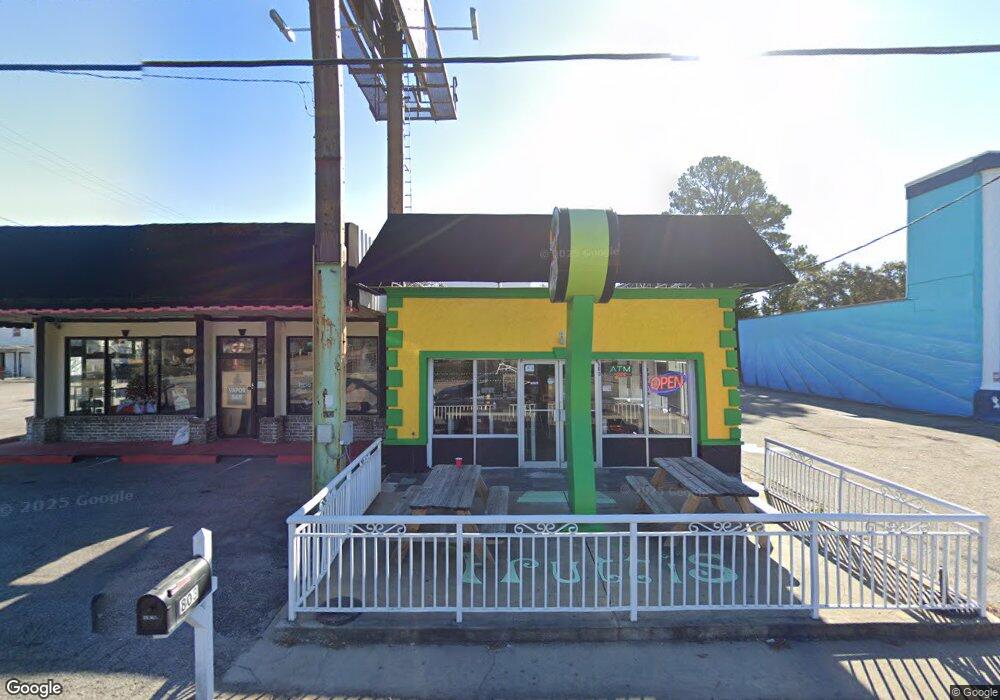
803 Highway 17 Myrtle Beach, SC 29577
Downtown Myrtle Beach NeighborhoodEstimated Value: $1,280,845
--
Bed
--
Bath
1,800
Sq Ft
$712/Sq Ft
Est. Value
About This Home
This home is located at 803 Highway 17, Myrtle Beach, SC 29577 and is currently estimated at $1,280,845, approximately $711 per square foot. 803 Highway 17 is a home located in Horry County with nearby schools including Myrtle Beach Child Development Center, Myrtle Beach Primary School, and Myrtle Beach Elementary School.
Ownership History
Date
Name
Owned For
Owner Type
Purchase Details
Closed on
Mar 29, 2024
Sold by
Shrem Jacob
Bought by
Chen Qi Xing
Current Estimated Value
Home Financials for this Owner
Home Financials are based on the most recent Mortgage that was taken out on this home.
Original Mortgage
$976,000
Outstanding Balance
$732,829
Interest Rate
6.94%
Mortgage Type
New Conventional
Estimated Equity
$548,016
Purchase Details
Closed on
Mar 12, 2004
Sold by
Shrem Eli and Mosseri Joseph
Bought by
Shrem Jacob
Create a Home Valuation Report for This Property
The Home Valuation Report is an in-depth analysis detailing your home's value as well as a comparison with similar homes in the area
Home Values in the Area
Average Home Value in this Area
Purchase History
| Date | Buyer | Sale Price | Title Company |
|---|---|---|---|
| Chen Qi Xing | $1,300,000 | -- | |
| Shrem Jacob | -- | -- |
Source: Public Records
Mortgage History
| Date | Status | Borrower | Loan Amount |
|---|---|---|---|
| Open | Chen Qi Xing | $976,000 |
Source: Public Records
Tax History Compared to Growth
Tax History
| Year | Tax Paid | Tax Assessment Tax Assessment Total Assessment is a certain percentage of the fair market value that is determined by local assessors to be the total taxable value of land and additions on the property. | Land | Improvement |
|---|---|---|---|---|
| 2024 | -- | $80,183 | $35,964 | $44,219 |
| 2023 | $11,684 | $48,410 | $19,980 | $28,430 |
| 2021 | $11,539 | $56,196 | $19,980 | $36,216 |
| 2020 | $11,418 | $56,196 | $19,980 | $36,216 |
| 2019 | $11,418 | $56,196 | $19,980 | $36,216 |
| 2018 | $0 | $42,096 | $19,980 | $22,116 |
| 2017 | $9,755 | $42,096 | $19,980 | $22,116 |
| 2016 | $0 | $42,096 | $19,980 | $22,116 |
| 2015 | -- | $42,096 | $19,980 | $22,116 |
| 2014 | $9,451 | $42,096 | $19,980 | $22,116 |
Source: Public Records
Map
Nearby Homes
- 317 Harbour View Dr
- 329 Harbour View Dr
- 338 Harbour View Dr Unit Lot 8 Boardwalk on t
- 908 Pelagic Loop
- 382 Harbour View Dr
- 517 Harbour View Dr Unit Lot 52
- 469 Harbour View Dr
- 1388 Speedway St Unit 480
- 410 Harbour View Dr
- 429 Harbour View Dr
- 852 Gammon Dr
- 450 Harbour View Dr Unit Lot 31
- 381 Hangar Ct
- 474 Harbour View Dr
- 128 Causey St
- 482 Harbour View Dr
- 147 Shetland Woods Dr
- 2212 Leeboard Ct
- 123 Shetland Woods Dr
- 514 Harbour View Dr
- 541 Piedmont Ave Unit Jetport Industrial P
- TDB Industrial Dr Unit Lot 28
- Dividend Loop Industrial Dr
- 3015 Drywall Dr Unit Jet Port Industrial
- 3015 Drywall Dr
- 3015 Drywall Dr
- R6 Lot 6 Market View
- R6 Lot 2 Market View
- R6 Lot 1 Market View
- R6 Lot 5 Market View
- 3014 Drywall Dr Unit B
- 3014 Drywall Dr
- R11 Market Common Lot 33
- R11 Market Common Lot 34
- R11 Market Common Lot 35
- R11 Market Common Lot 26
- R11 Market Common Lot 30
- R11 Market Common Lot 24
- R5 Market Common Lot 2
- R5 Market Common Lot 7