803 Jackson Ave Dixon, IL 61021
South Dixon NeighborhoodEstimated Value: $61,000 - $170,000
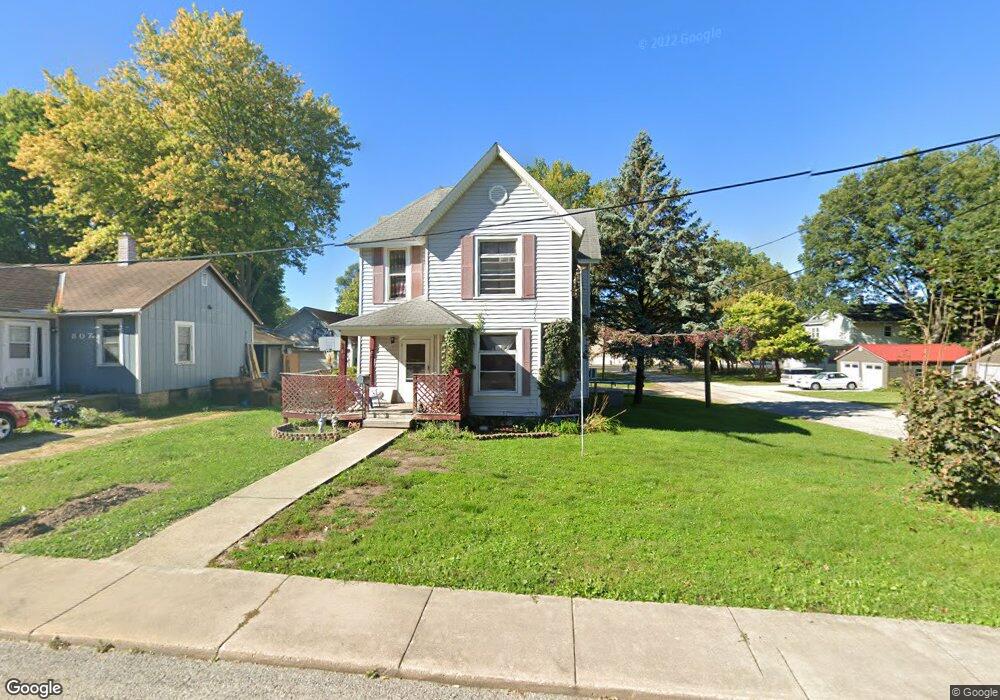
About This Home
This home is located at 803 Jackson Ave, Dixon, IL 61021 and is currently estimated at $112,184, approximately $50 per square foot. 803 Jackson Ave is a home located in Lee County with nearby schools including Washington Elementary School, Madison Elementary School, and Jefferson Elementary School.
Ownership History
We collect this data history from publicly available records. To have your information removed, we recommend requesting removal directly through your county’s website.
Purchase Details
Purchase Details
Purchase Details
Purchase Details
Home Financials for this Owner
Home Financials are based on the most recent Mortgage that was taken out on this home.Purchase Details
Home Values in the Area
Average Home Value in this Area
Purchase History
We collect this data history from publicly available records. To have your information removed, we recommend requesting removal directly through your county’s website.
| Date | Buyer | Sale Price | Title Company |
|---|---|---|---|
| $4,000,000 | None Available | ||
| -- | None Available | ||
| -- | None Available | ||
| $80,000 | None Available | ||
| -- | None Available |
Mortgage History
We collect this data history from publicly available records. To have your information removed, we recommend requesting removal directly through your county’s website.
| Date | Status | Borrower | Loan Amount |
|---|---|---|---|
| Previous Owner | $78,900 |
Tax History
We collect this data history from publicly available records. To have your information removed, we recommend requesting removal directly through your county’s website.
| Year | Tax Paid | Tax Assessment Tax Assessment Total Assessment is a certain percentage of the fair market value that is determined by local assessors to be the total taxable value of land and additions on the property. | Land | Improvement |
|---|---|---|---|---|
| 2024 | $1,390 | $21,177 | $4,840 | $16,337 |
| 2023 | $1,099 | $19,428 | $4,440 | $14,988 |
| 2022 | $1,099 | $17,503 | $4,000 | $13,503 |
| 2021 | $985 | $16,207 | $3,704 | $12,503 |
| 2020 | $921 | $15,436 | $3,528 | $11,908 |
| 2019 | $882 | $14,986 | $3,425 | $11,561 |
| 2018 | $837 | $14,692 | $3,358 | $11,334 |
| 2017 | $782 | $14,127 | $3,229 | $10,898 |
| 2016 | $746 | $13,716 | $3,135 | $10,581 |
| 2015 | $715 | $13,716 | $3,135 | $10,581 |
| 2014 | $703 | $13,716 | $3,135 | $10,581 |
| 2013 | $713 | $14,000 | $3,200 | $10,800 |
Map
- 918 Jackson Ave
- 913 W 4th St
- 1100 S Lincoln Ave
- 323 Douglas Ave
- 326 Logan Ave
- 305 Monroe Ave
- 722 Highland Ave
- 1510 W 2nd St
- 512 Highland Ave
- 907 S Peoria Ave
- 215 W 7th St
- 1503 Eadens Place
- 1513 Eadens Place
- Lot 8 Creek Ridge Dr
- tbd E Corporate Dr and Bloody Gulch Rd
- 1715 W River St Unit 1715
- 792 Brandon Wyley Dr Unit 1
- 1903 W 1st St
- 720 S Ottawa Ave
- 080940015 Bloody Gulch Rd
- 807 Jackson Ave
- 804 Jackson Ave
- 808 Jackson Ave
- 809 Jackson Ave
- 721 Jackson Ave
- 813 Jackson Ave
- 715 Jackson Ave
- 810 Jackson Ave
- 817 Jackson Ave
- 724 Jackson Ave
- 814 Jackson Ave
- 1119 W 8th St
- 713 Jackson Ave
- 718 Jackson Ave
- 821 Jackson Ave
- 716 Jackson Ave
- 816 Jackson Ave
- 824 Jackson Ave
- 711 Jackson Ave
- 1011 W 8th St
Ask me questions while you tour the home.