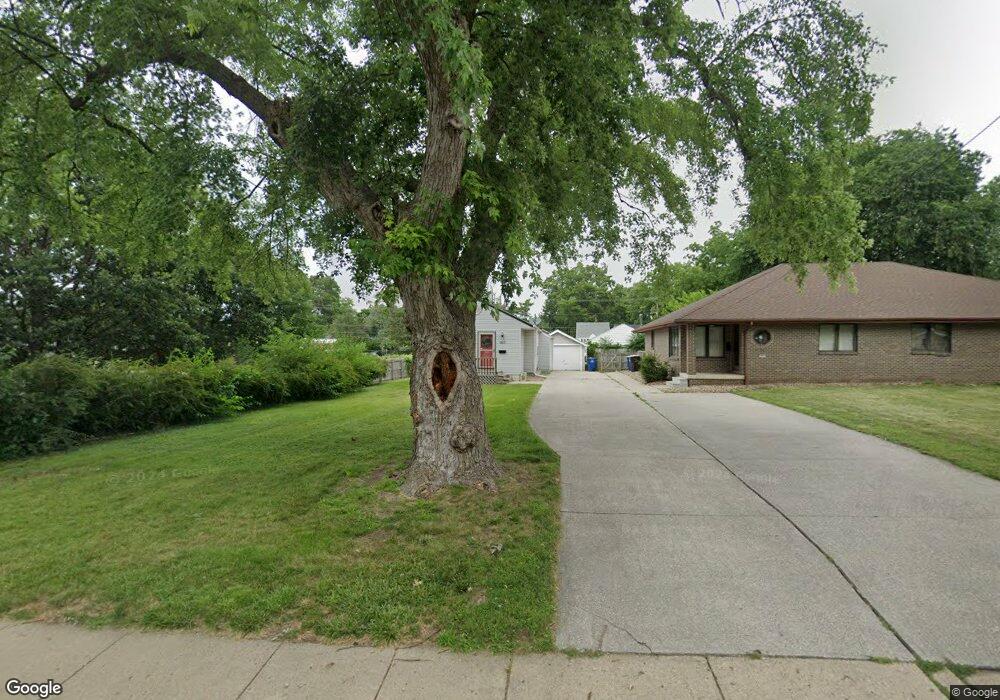
803 Leach Ave Des Moines, IA 50315
Watrous Heights NeighborhoodEstimated Value: $132,000 - $161,000
2
Beds
1
Bath
685
Sq Ft
$222/Sq Ft
Est. Value
About This Home
This home is located at 803 Leach Ave, Des Moines, IA 50315 and is currently estimated at $152,016, approximately $221 per square foot. 803 Leach Ave is a home located in Polk County with nearby schools including South Union Elementary School, Brody Middle School, and Lincoln High School.
Ownership History
Date
Name
Owned For
Owner Type
Purchase Details
Closed on
Nov 6, 2023
Sold by
Whitley Carson M
Bought by
Whitley Carson M and Porter Kelsey
Current Estimated Value
Home Financials for this Owner
Home Financials are based on the most recent Mortgage that was taken out on this home.
Original Mortgage
$116,250
Outstanding Balance
$114,045
Interest Rate
7.31%
Mortgage Type
New Conventional
Estimated Equity
$37,971
Purchase Details
Closed on
Nov 1, 2023
Sold by
Bennett John R and Bennett Donna J
Bought by
Whitley Carson
Home Financials for this Owner
Home Financials are based on the most recent Mortgage that was taken out on this home.
Original Mortgage
$116,250
Outstanding Balance
$114,045
Interest Rate
7.31%
Mortgage Type
New Conventional
Estimated Equity
$37,971
Create a Home Valuation Report for This Property
The Home Valuation Report is an in-depth analysis detailing your home's value as well as a comparison with similar homes in the area
Home Values in the Area
Average Home Value in this Area
Purchase History
| Date | Buyer | Sale Price | Title Company |
|---|---|---|---|
| Whitley Carson M | -- | None Listed On Document | |
| Whitley Carson M | -- | None Listed On Document | |
| Whitley Carson | $155,000 | None Listed On Document | |
| Whitley Carson | $155,000 | None Listed On Document |
Source: Public Records
Mortgage History
| Date | Status | Borrower | Loan Amount |
|---|---|---|---|
| Open | Whitley Carson | $116,250 | |
| Closed | Whitley Carson | $116,250 |
Source: Public Records
Tax History Compared to Growth
Tax History
| Year | Tax Paid | Tax Assessment Tax Assessment Total Assessment is a certain percentage of the fair market value that is determined by local assessors to be the total taxable value of land and additions on the property. | Land | Improvement |
|---|---|---|---|---|
| 2025 | $2,264 | $138,600 | $33,200 | $105,400 |
| 2024 | $2,264 | $115,100 | $28,900 | $86,200 |
| 2023 | $2,178 | $115,100 | $28,900 | $86,200 |
| 2022 | $2,162 | $92,400 | $23,800 | $68,600 |
| 2021 | $2,172 | $92,400 | $23,800 | $68,600 |
| 2020 | $2,256 | $87,000 | $22,300 | $64,700 |
| 2019 | $2,214 | $87,000 | $22,300 | $64,700 |
| 2018 | $2,192 | $82,400 | $19,500 | $62,900 |
| 2017 | $2,082 | $82,400 | $19,500 | $62,900 |
| 2016 | $2,030 | $77,000 | $18,000 | $59,000 |
| 2015 | $2,030 | $77,000 | $18,000 | $59,000 |
| 2014 | $1,994 | $77,900 | $17,800 | $60,100 |
Source: Public Records
Map
Nearby Homes