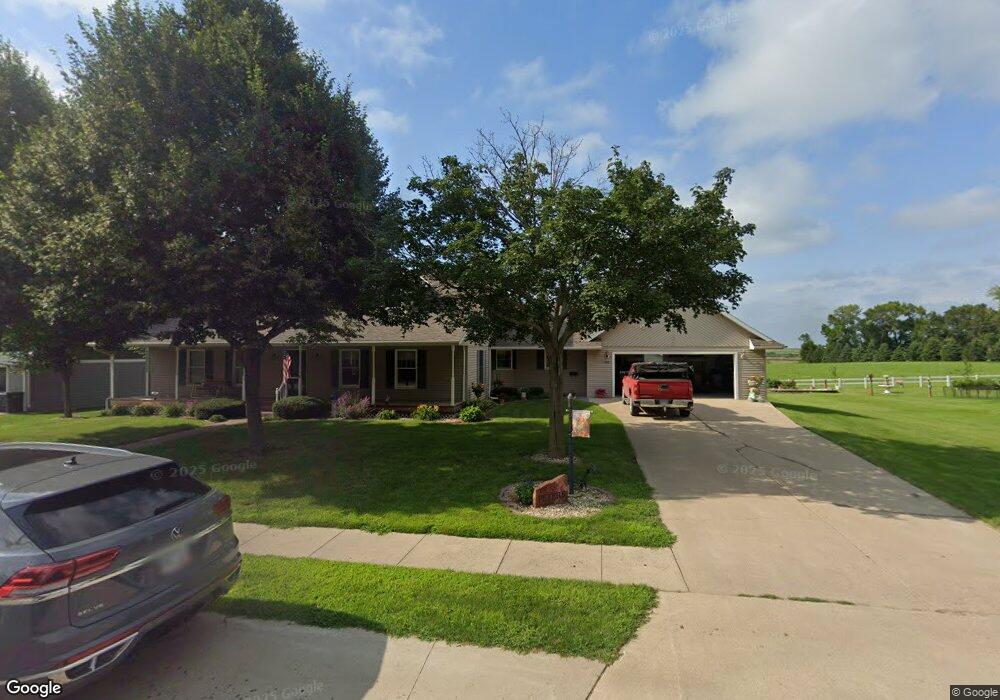
803 Leland St Little Rock, IA 51243
Estimated Value: $142,000 - $392,271
--
Bed
1
Bath
2,282
Sq Ft
$113/Sq Ft
Est. Value
About This Home
This home is located at 803 Leland St, Little Rock, IA 51243 and is currently estimated at $258,068, approximately $113 per square foot. 803 Leland St is a home located in Lyon County with nearby schools including George-Little Rock Senior High School.
Ownership History
Date
Name
Owned For
Owner Type
Purchase Details
Closed on
Jul 26, 2024
Sold by
Peters Gene S
Bought by
Freerks Randall C and Freerks Janice L
Current Estimated Value
Purchase Details
Closed on
Jul 12, 2024
Sold by
Peters Mark S
Bought by
Borer Rodney Allen and Borer Phyllis Kay
Purchase Details
Closed on
Apr 1, 2022
Sold by
Peters Gene S
Bought by
Peters Gene S and Gene S Petes Rlt
Create a Home Valuation Report for This Property
The Home Valuation Report is an in-depth analysis detailing your home's value as well as a comparison with similar homes in the area
Home Values in the Area
Average Home Value in this Area
Purchase History
| Date | Buyer | Sale Price | Title Company |
|---|---|---|---|
| Freerks Randall C | -- | None Listed On Document | |
| Freerks Randall C | -- | None Listed On Document | |
| Borer Rodney Allen | -- | None Listed On Document | |
| Borer Rodney Allen | -- | None Listed On Document | |
| Peters Gene S | $3,625 | None Listed On Document |
Source: Public Records
Tax History Compared to Growth
Tax History
| Year | Tax Paid | Tax Assessment Tax Assessment Total Assessment is a certain percentage of the fair market value that is determined by local assessors to be the total taxable value of land and additions on the property. | Land | Improvement |
|---|---|---|---|---|
| 2025 | $3,848 | $369,990 | $26,670 | $343,320 |
| 2024 | $3,132 | $295,530 | $26,950 | $268,580 |
| 2023 | $3,132 | $248,440 | $26,950 | $221,490 |
| 2022 | $2,976 | $192,980 | $26,950 | $166,030 |
| 2021 | $2,976 | $192,980 | $26,950 | $166,030 |
| 2020 | $2,744 | $164,890 | $18,070 | $146,820 |
| 2019 | $2,760 | $159,600 | $0 | $0 |
| 2018 | $2,676 | $159,600 | $0 | $0 |
| 2017 | $2,314 | $139,460 | $0 | $0 |
| 2016 | $2,258 | $139,460 | $0 | $0 |
| 2015 | $2,258 | $142,635 | $0 | $0 |
| 2014 | $2,270 | $142,635 | $0 | $0 |
Source: Public Records
Map
Nearby Homes