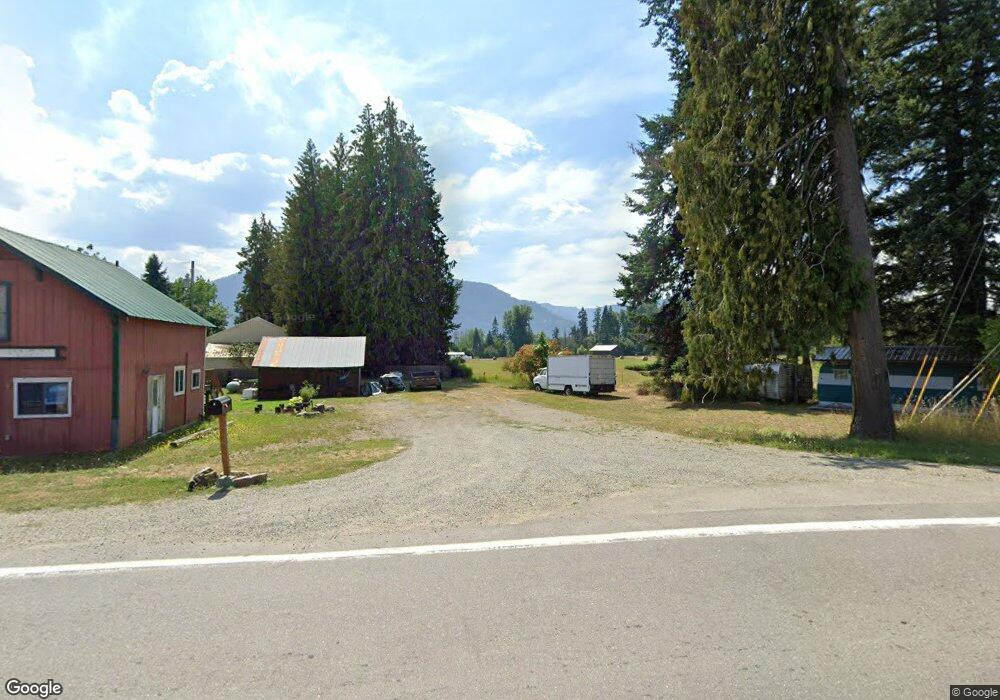
803 N Pine St Clark Fork, ID 83811
Estimated Value: $478,000 - $735,052
4
Beds
4
Baths
4,186
Sq Ft
$150/Sq Ft
Est. Value
About This Home
This home is located at 803 N Pine St, Clark Fork, ID 83811 and is currently estimated at $626,013, approximately $149 per square foot. 803 N Pine St is a home with nearby schools including Hope Elementary School and Clark Fork Junior/Senior High School.
Ownership History
Date
Name
Owned For
Owner Type
Purchase Details
Closed on
Jun 13, 2011
Sold by
Thornton George D
Bought by
Thornton George and Thornton Rebecca P
Current Estimated Value
Create a Home Valuation Report for This Property
The Home Valuation Report is an in-depth analysis detailing your home's value as well as a comparison with similar homes in the area
Home Values in the Area
Average Home Value in this Area
Purchase History
| Date | Buyer | Sale Price | Title Company |
|---|---|---|---|
| Thornton George | -- | -- |
Source: Public Records
Tax History
| Year | Tax Paid | Tax Assessment Tax Assessment Total Assessment is a certain percentage of the fair market value that is determined by local assessors to be the total taxable value of land and additions on the property. | Land | Improvement |
|---|---|---|---|---|
| 2025 | $3,109 | $789,503 | $132,003 | $657,500 |
| 2024 | $4,112 | $779,163 | $132,003 | $647,160 |
| 2023 | $3,334 | $774,953 | $132,003 | $642,950 |
| 2022 | $5,073 | $999,702 | $77,002 | $922,700 |
| 2021 | $2,688 | $439,313 | $53,751 | $385,562 |
| 2020 | $3,051 | $428,724 | $44,001 | $384,723 |
| 2019 | $3,417 | $554,326 | $44,001 | $510,325 |
| 2018 | $3,291 | $463,833 | $41,910 | $421,923 |
| 2017 | $3,291 | $431,875 | $0 | $0 |
| 2016 | $3,154 | $399,036 | $0 | $0 |
| 2015 | -- | $337,621 | $0 | $0 |
| 2014 | -- | $256,591 | $0 | $0 |
Source: Public Records
Map
Nearby Homes
- 109 W 6th Ave
- nna Lightning Creek Rd
- 60317 Idaho 200
- 210 W 3rd Ave
- NNA Hwy 200
- 517 N Stephen St
- 102 E 2nd Ave
- 16 Elk Horn
- 103 N Stephen St
- NKA Silver Creek Rd
- 53465 Idaho 200
- 374 Carbine Dr
- 241 N River Lake Dr
- 940 Sled Run Trail
- 526 Mountain View Rd
- 582 Mountain View Rd
- 76 Shadow Valley Ln
- 123 E Mountain View Rd
- 58250 Idaho 200
- Tract 3 Usfs 2294
Your Personal Tour Guide
Ask me questions while you tour the home.