803 N St SW Cedar Rapids, IA 52404
Taylor NeighborhoodEstimated payment $686/month
Highlights
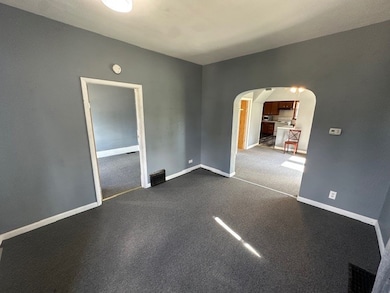
- Main Floor Primary Bedroom
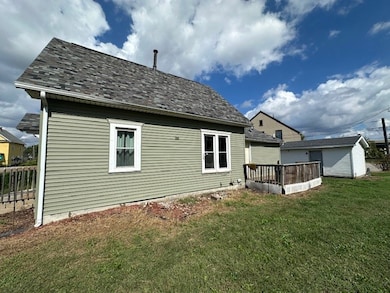
- 1 Car Detached Garage
- Heating System Uses Gas
- No HOA
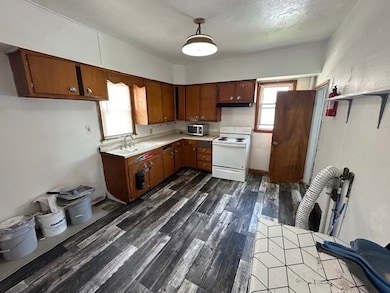
- Eat-In Kitchen
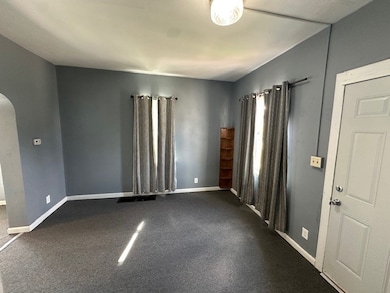
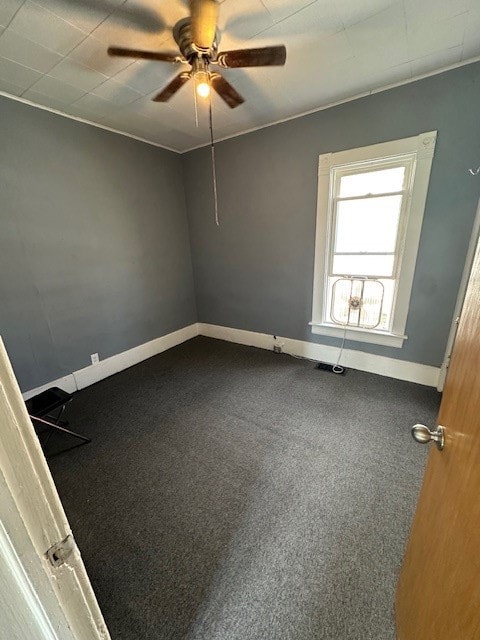
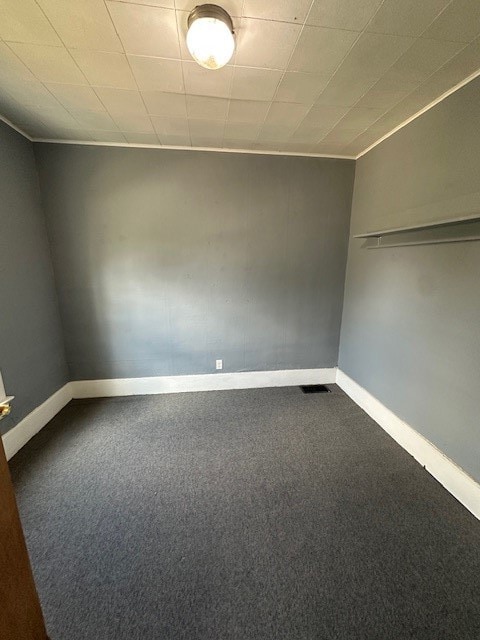
About This Home
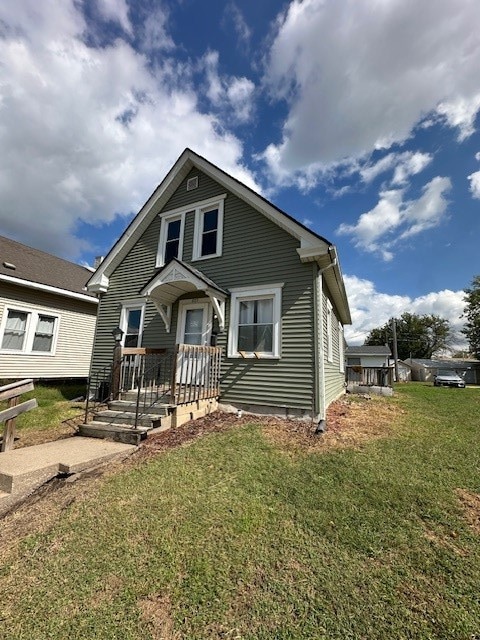
Perfect for first time home buyer or investor. This 3 bedroom home has a 1 car garage and is located on a dead end street with easy access to interstate and all that our downtown has to offer. Vinyl siding, vinyl windows and a newer roof make this a great value. No flood insurance is required. Property being sold As-Is.
Home Details
Home Type
- Single Family
Est. Annual Taxes
- $1,752
Year Built
- Built in 1900
Parking
- 1 Car Detached Garage
Home Design
- Frame Construction
- Vinyl Siding
Interior Spaces
- 982 Sq Ft Home
- 1.5-Story Property
- Basement Fills Entire Space Under The House
Kitchen
- Eat-In Kitchen
- Range
Bedrooms and Bathrooms
- 3 Bedrooms
- Primary Bedroom on Main
- 1 Full Bathroom
Schools
- Taylor Elementary School
- Wilson Middle School
- Jefferson High School
Additional Features
- 3,920 Sq Ft Lot
- Heating System Uses Gas
Community Details
- No Home Owners Association
Listing and Financial Details
- Assessor Parcel Number 142833300300000
Map
Home Values in the Area
Average Home Value in this Area
Tax History
| Year | Tax Paid | Tax Assessment Tax Assessment Total Assessment is a certain percentage of the fair market value that is determined by local assessors to be the total taxable value of land and additions on the property. | Land | Improvement |
|---|---|---|---|---|
| 2025 | $1,712 | $100,900 | $23,700 | $77,200 |
| 2024 | $1,360 | $96,700 | $21,800 | $74,900 |
| 2023 | $1,360 | $96,700 | $21,800 | $74,900 |
| 2022 | $1,226 | $64,500 | $18,200 | $46,300 |
| 2021 | $1,204 | $59,200 | $18,200 | $41,000 |
| 2020 | $1,204 | $54,600 | $16,400 | $38,200 |
| 2019 | $1,146 | $53,200 | $16,400 | $36,800 |
| 2018 | $1,116 | $53,200 | $16,400 | $36,800 |
| 2017 | $1,072 | $52,100 | $16,400 | $35,700 |
| 2016 | $1,072 | $50,400 | $13,900 | $36,500 |
| 2015 | $1,208 | $56,741 | $13,923 | $42,818 |
| 2014 | $1,208 | $56,741 | $13,923 | $42,818 |
| 2013 | $591 | $56,741 | $13,923 | $42,818 |
Property History
| Date | Event | Price | List to Sale | Price per Sq Ft |
|---|---|---|---|---|
| 11/04/2025 11/04/25 | Price Changed | $102,500 | -1.0% | $104 / Sq Ft |
| 10/17/2025 10/17/25 | Price Changed | $103,500 | -1.4% | $105 / Sq Ft |
| 09/25/2025 09/25/25 | For Sale | $105,000 | -- | $107 / Sq Ft |
Purchase History
| Date | Type | Sale Price | Title Company |
|---|---|---|---|
| Warranty Deed | -- | None Available | |
| Special Warranty Deed | $32,000 | None Available | |
| Sheriffs Deed | $95,025 | None Available | |
| Warranty Deed | $87,500 | -- |
Mortgage History
| Date | Status | Loan Amount | Loan Type |
|---|---|---|---|
| Previous Owner | $34,500 | Purchase Money Mortgage | |
| Previous Owner | $79,200 | Unknown |
Source: Cedar Rapids Area Association of REALTORS®
MLS Number: 2508145
APN: 14283-33003-00000
Disclaimer: Certain information contained herein is derived from information provided by parties other than Homes.com. All information provided is deemed reliable, but is not guaranteed to be accurate and should be independently verified.
![]() IDX information is provided exclusively for personal, non-commercial use, and may not be used for any purpose other than to identify prospective properties consumers may be interested in purchasing.
IDX information is provided exclusively for personal, non-commercial use, and may not be used for any purpose other than to identify prospective properties consumers may be interested in purchasing.
Information is deemed reliable but not guaranteed.
- 217 7th Ave SW
- 600 2nd St SW
- 901 9th St SW Unit Upper
- 702 9th St SW Unit 2
- 640 16th Ave SW
- 100 1st Ave NE
- 900 3rd St SE
- 200 1st Ave NE
- 501 4th Ave SE
- 627 6th St SE
- 411 1st Ave SE
- 605 G Ave NW
- 455 16th Ave SE
- 475 16th Ave SE
- 1150 6th St SE
- 25-85 Aossey Ln SW
- 906 10th St SE
- 2211 C St SW
- 2981 6th St SW
- 1400 2nd Ave SW
