Estimated Value: $386,000 - $414,000
3
Beds
2
Baths
1,286
Sq Ft
$313/Sq Ft
Est. Value
About This Home
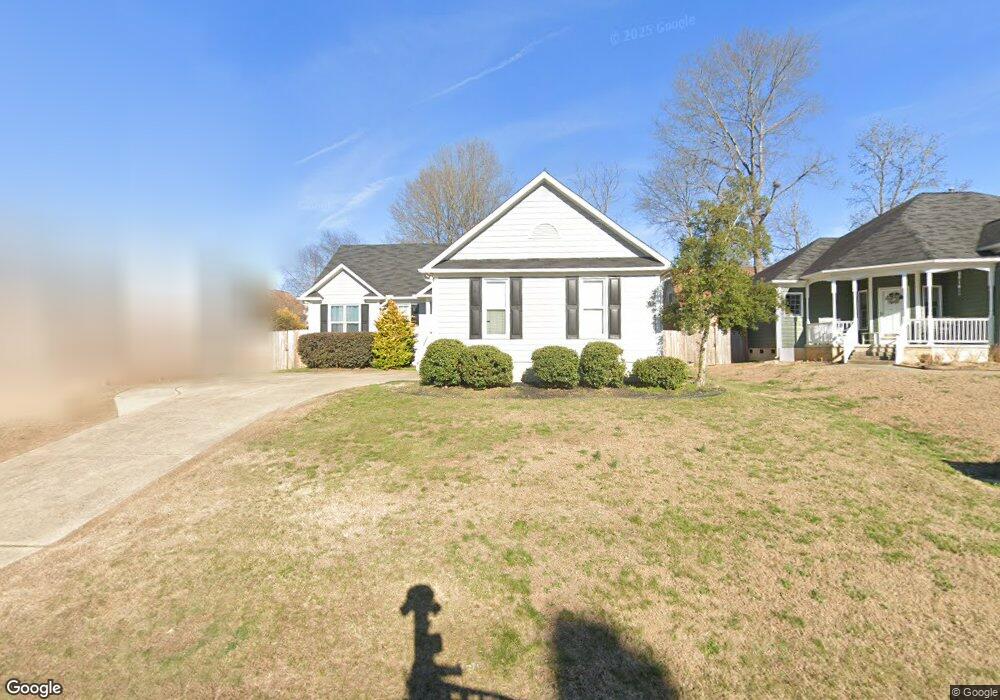
This home is located at 803 Teulon Way, Apex, NC 27502 and is currently estimated at $402,145, approximately $312 per square foot. 803 Teulon Way is a home located in Wake County with nearby schools including Apex Elementary School, Apex Middle, and Apex High School.
Ownership History
Date
Name
Owned For
Owner Type
Purchase Details
Closed on
Mar 30, 2023
Sold by
Putnam Robert D
Bought by
Spring Nicholas K
Current Estimated Value
Home Financials for this Owner
Home Financials are based on the most recent Mortgage that was taken out on this home.
Original Mortgage
$375,000
Outstanding Balance
$304,741
Interest Rate
6.32%
Mortgage Type
Seller Take Back
Estimated Equity
$97,404
Purchase Details
Closed on
Jan 30, 2009
Sold by
Michnowicz James C and Michnowicz Stephanie P
Bought by
Putnam Robert D and Putnam Jean A
Purchase Details
Closed on
Jun 14, 2006
Sold by
Petersen Bryan A and Ritter Petersen Sherry
Bought by
Michnowicz James C and Michnowicz Stephanie P
Home Financials for this Owner
Home Financials are based on the most recent Mortgage that was taken out on this home.
Original Mortgage
$126,800
Interest Rate
6.51%
Mortgage Type
Purchase Money Mortgage
Purchase Details
Closed on
Oct 14, 1997
Sold by
Bozeman Charles T
Bought by
Petersen Bryan A and Ritter Petersen Sherry
Create a Home Valuation Report for This Property
The Home Valuation Report is an in-depth analysis detailing your home's value as well as a comparison with similar homes in the area
Purchase History
| Date | Buyer | Sale Price | Title Company |
|---|---|---|---|
| Spring Nicholas K | $375,000 | -- | |
| Putnam Robert D | $170,000 | None Available | |
| Michnowicz James C | $158,500 | None Available | |
| Petersen Bryan A | $134,000 | -- |
Source: Public Records
Mortgage History
| Date | Status | Borrower | Loan Amount |
|---|---|---|---|
| Open | Spring Nicholas K | $375,000 | |
| Previous Owner | Michnowicz James C | $126,800 | |
| Previous Owner | Michnowicz James C | $15,850 |
Source: Public Records
Tax History
| Year | Tax Paid | Tax Assessment Tax Assessment Total Assessment is a certain percentage of the fair market value that is determined by local assessors to be the total taxable value of land and additions on the property. | Land | Improvement |
|---|---|---|---|---|
| 2025 | $3,533 | $402,407 | $190,000 | $212,407 |
| 2024 | $3,455 | $402,407 | $190,000 | $212,407 |
Source: Public Records
Map
Nearby Homes
- 318 Glaston Ct
- 101 Harbor Haven Dr
- 1039 Dual Parks Rd
- 0-2932 Tingen Rd
- 1750 Minley Way
- 314 Wrenn St
- 1434 Salem Creek Dr
- 736 Treviso Ln
- 305 Anterbury Dr
- 307 S Elm St
- 1614 Brussels Dr
- 810 Bryn Mawr Ct
- 804 Olive St
- 203 Milky Way Dr
- 909 Bryn Mawr Ct
- 105 Cunningham St
- 102 Licorice Dr
- 120 Licorice Dr
- 111 Lemon Drop Cir
- 311 Culvert St
Your Personal Tour Guide
Ask me questions while you tour the home.