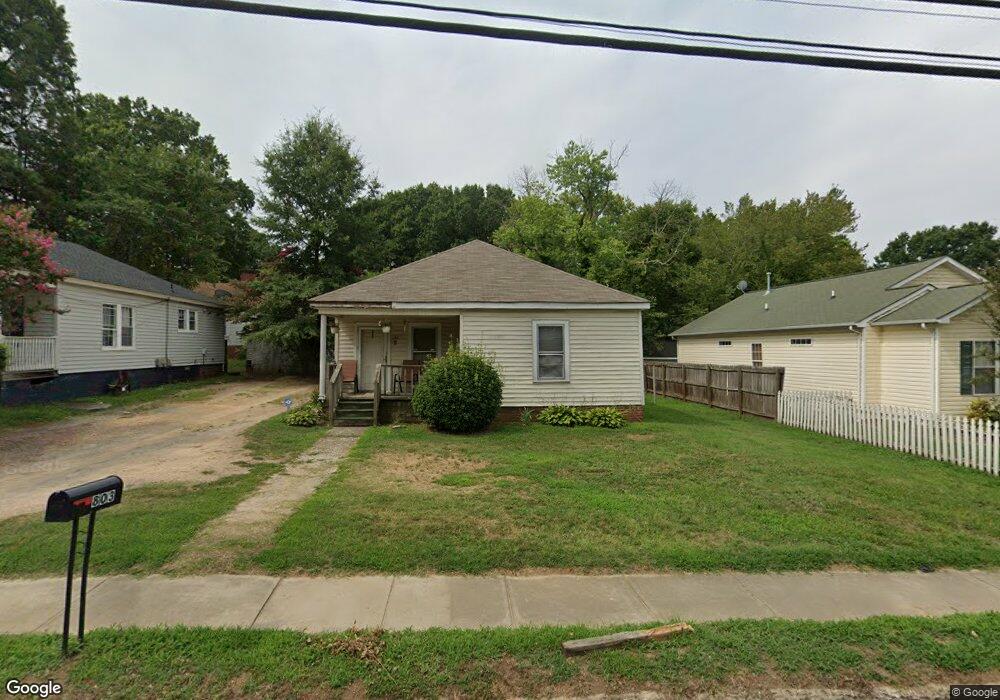
803 W C St Kannapolis, NC 28081
Estimated Value: $207,000 - $230,000
2
Beds
1
Bath
1,159
Sq Ft
$186/Sq Ft
Est. Value
About This Home
This home is located at 803 W C St, Kannapolis, NC 28081 and is currently estimated at $215,689, approximately $186 per square foot. 803 W C St is a home located in Cabarrus County with nearby schools including Fred L. Wilson Elementary School, Kannapolis Middle, and A.L. Brown High School.
Ownership History
Date
Name
Owned For
Owner Type
Purchase Details
Closed on
Mar 3, 2022
Sold by
Wagers Gary W and Wagers Jean W
Bought by
Hlb Contracting & Rental Properties Llc
Current Estimated Value
Purchase Details
Closed on
Jan 31, 2019
Sold by
Wagers Gary W and Wagers Jean W
Bought by
Brooks Kenneth and Brooks Rebekah
Purchase Details
Closed on
Nov 1, 1988
Bought by
Wagers Gary W and Wife Jean W
Create a Home Valuation Report for This Property
The Home Valuation Report is an in-depth analysis detailing your home's value as well as a comparison with similar homes in the area
Home Values in the Area
Average Home Value in this Area
Purchase History
| Date | Buyer | Sale Price | Title Company |
|---|---|---|---|
| Hlb Contracting & Rental Properties Llc | -- | Howard S Irvin Pa | |
| Brooks Kenneth | $43,500 | None Available | |
| Wagers Gary W | $20,000 | -- |
Source: Public Records
Mortgage History
| Date | Status | Borrower | Loan Amount |
|---|---|---|---|
| Closed | Brooks Kenneth | $0 |
Source: Public Records
Tax History
| Year | Tax Paid | Tax Assessment Tax Assessment Total Assessment is a certain percentage of the fair market value that is determined by local assessors to be the total taxable value of land and additions on the property. | Land | Improvement |
|---|---|---|---|---|
| 2025 | $2,215 | $195,090 | $85,000 | $110,090 |
| 2024 | $2,215 | $195,090 | $85,000 | $110,090 |
| 2023 | $1,325 | $96,710 | $64,030 | $32,680 |
| 2022 | $1,325 | $96,710 | $64,030 | $32,680 |
| 2021 | $1,325 | $96,710 | $64,030 | $32,680 |
| 2020 | $1,325 | $96,710 | $64,030 | $32,680 |
| 2019 | $809 | $59,080 | $20,380 | $38,700 |
| 2018 | $798 | $59,080 | $20,380 | $38,700 |
| 2017 | $786 | $59,080 | $20,380 | $38,700 |
| 2016 | -- | $70,500 | $30,580 | $39,920 |
| 2015 | $888 | $70,500 | $30,580 | $39,920 |
| 2014 | $888 | $70,500 | $30,580 | $39,920 |
Source: Public Records
Map
Nearby Homes
- 108 Hemlock Ave
- 511 W D St
- 808 W B St
- 5451 Comiskey Aly
- 1022 W C St
- 5820 Pittmon Ln
- 132 Glenn Ave
- 5840 Pittmon Ln
- 5850 Pittmon Ln
- 5860 Pittmon Ln
- 211 Franklin Ave
- 427 Pleasant Ave
- 1105 S Walnut St
- 3150 Baines Ct
- 6351 Lopez Ct
- 1021 Elm St
- 110 Franklin Ave
- TBD Magnolia Ave
- 500 Echo Ave
- 200 Martin Luther King Junior Ave
Your Personal Tour Guide
Ask me questions while you tour the home.