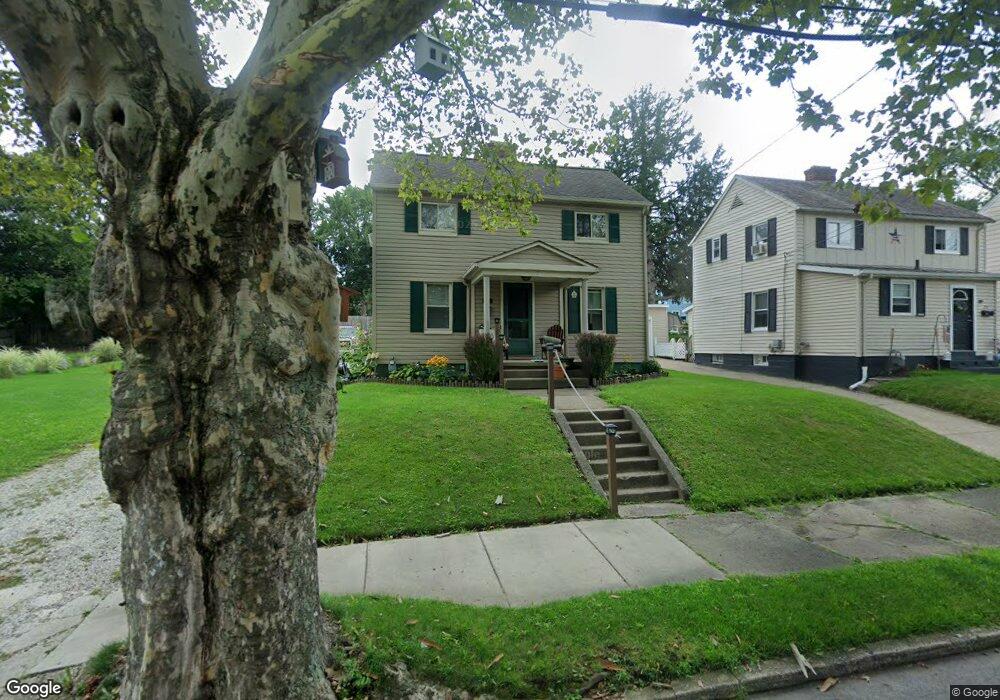
803 Waugh St Alliance, OH 44601
Estimated Value: $106,047 - $125,000
2
Beds
1
Bath
936
Sq Ft
$124/Sq Ft
Est. Value
About This Home
This home is located at 803 Waugh St, Alliance, OH 44601 and is currently estimated at $116,262, approximately $124 per square foot. 803 Waugh St is a home located in Stark County with nearby schools including Alliance Elementary School at Rockhill, Alliance Intermediate School at Northside, and Alliance Middle School.
Ownership History
Date
Name
Owned For
Owner Type
Purchase Details
Closed on
Feb 6, 2026
Sold by
Godsey David B E
Bought by
Godsey Lisa A and Godsey David B
Current Estimated Value
Purchase Details
Closed on
Dec 5, 1995
Sold by
Sera Julia
Bought by
Godsey David B
Home Financials for this Owner
Home Financials are based on the most recent Mortgage that was taken out on this home.
Original Mortgage
$18,500
Interest Rate
7.44%
Mortgage Type
New Conventional
Create a Home Valuation Report for This Property
The Home Valuation Report is an in-depth analysis detailing your home's value as well as a comparison with similar homes in the area
Home Values in the Area
Average Home Value in this Area
Purchase History
| Date | Buyer | Sale Price | Title Company |
|---|---|---|---|
| Godsey Lisa A | -- | None Listed On Document | |
| Godsey David B | $20,000 | -- |
Source: Public Records
Mortgage History
| Date | Status | Borrower | Loan Amount |
|---|---|---|---|
| Previous Owner | Godsey David B | $18,500 |
Source: Public Records
Tax History
| Year | Tax Paid | Tax Assessment Tax Assessment Total Assessment is a certain percentage of the fair market value that is determined by local assessors to be the total taxable value of land and additions on the property. | Land | Improvement |
|---|---|---|---|---|
| 2025 | -- | $26,610 | $5,290 | $21,320 |
| 2024 | -- | $26,610 | $5,290 | $21,320 |
| 2023 | $773 | $18,770 | $5,080 | $13,690 |
| 2022 | $389 | $18,770 | $5,080 | $13,690 |
| 2021 | $780 | $18,770 | $5,080 | $13,690 |
| 2020 | $676 | $15,190 | $4,410 | $10,780 |
| 2019 | $667 | $15,190 | $4,410 | $10,780 |
| 2018 | $670 | $15,190 | $4,410 | $10,780 |
| 2017 | $582 | $12,960 | $3,710 | $9,250 |
| 2016 | $586 | $12,960 | $3,710 | $9,250 |
| 2015 | $582 | $12,750 | $3,710 | $9,040 |
| 2014 | $558 | $11,630 | $3,400 | $8,230 |
| 2013 | $278 | $11,630 | $3,400 | $8,230 |
Source: Public Records
Map
Nearby Homes
- 834 Devine St
- 1522 Wade Ave
- 1350 S Freedom Ave
- 935 S Morgan Ave
- 233 Shadyside Ct
- 225 Shadyside Ct
- 167 11th St
- 955 E Summit St
- 231 Rosenberry St
- 234 Rosenberry St
- 134 11th St
- 452 E Summit St
- 726 S Arch Ave
- 46 Rosenberry St
- 442 S Liberty Ave
- 152 E Mill St
- 807 S Union Ave
- 2464 S Freedom Ave
- V/L S Freedom Ave
- 853 Fairway Dr
Your Personal Tour Guide
Ask me questions while you tour the home.