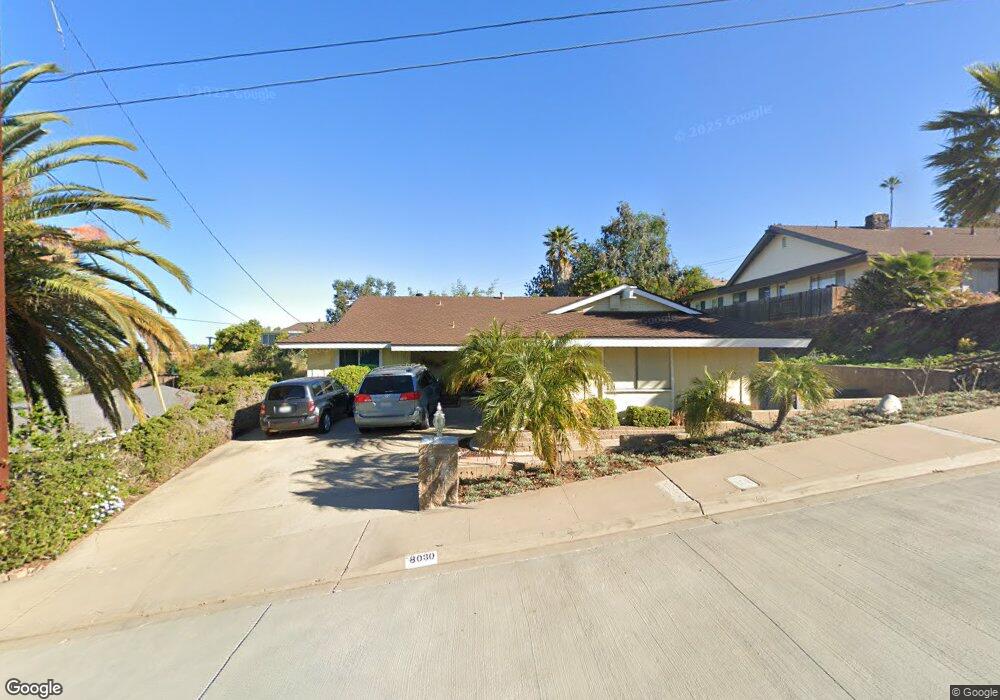
8030 Wetherley St La Mesa, CA 91941
Estimated Value: $1,063,880 - $1,201,000
3
Beds
2
Baths
1,836
Sq Ft
$607/Sq Ft
Est. Value
About This Home
This home is located at 8030 Wetherley St, La Mesa, CA 91941 and is currently estimated at $1,114,720, approximately $607 per square foot. 8030 Wetherley St is a home located in San Diego County with nearby schools including La Mesa Arts Academy, La Mesa Dale Elementary School, and Mount Miguel High School.
Ownership History
Date
Name
Owned For
Owner Type
Purchase Details
Closed on
Jun 28, 2019
Sold by
Engen John A and Holmstrom Gerda F
Bought by
Engen John A and Holmstrom Gerda F
Current Estimated Value
Home Financials for this Owner
Home Financials are based on the most recent Mortgage that was taken out on this home.
Original Mortgage
$272,700
Outstanding Balance
$179,034
Interest Rate
3.82%
Mortgage Type
New Conventional
Estimated Equity
$935,686
Purchase Details
Closed on
Aug 25, 2017
Sold by
Engen John A and Holmstrom Gerda F
Bought by
Engen John A and Holmstrom Gerda F
Purchase Details
Closed on
Jan 26, 2004
Sold by
Battisti Patrick F and Battisti Irene
Bought by
Engen John A and Holmstrom Gerda F
Home Financials for this Owner
Home Financials are based on the most recent Mortgage that was taken out on this home.
Original Mortgage
$444,000
Interest Rate
4.75%
Mortgage Type
New Conventional
Create a Home Valuation Report for This Property
The Home Valuation Report is an in-depth analysis detailing your home's value as well as a comparison with similar homes in the area
Purchase History
| Date | Buyer | Sale Price | Title Company |
|---|---|---|---|
| Engen John A | -- | Corinthian Title Company Inc | |
| Engen John A | -- | Corinthian Title Company Inc | |
| Engen John A | -- | None Available | |
| Engen John A | $555,000 | Commonwealth Land Title |
Source: Public Records
Mortgage History
| Date | Status | Borrower | Loan Amount |
|---|---|---|---|
| Open | Engen John A | $272,700 | |
| Closed | Engen John A | $444,000 |
Source: Public Records
Tax History
| Year | Tax Paid | Tax Assessment Tax Assessment Total Assessment is a certain percentage of the fair market value that is determined by local assessors to be the total taxable value of land and additions on the property. | Land | Improvement |
|---|---|---|---|---|
| 2025 | $9,797 | $789,053 | $426,516 | $362,537 |
| 2024 | $9,797 | $773,582 | $418,153 | $355,429 |
| 2023 | $9,539 | $758,414 | $409,954 | $348,460 |
| 2022 | $9,430 | $743,544 | $401,916 | $341,628 |
| 2021 | $8,677 | $680,000 | $364,000 | $316,000 |
| 2020 | $8,165 | $650,000 | $348,000 | $302,000 |
| 2019 | $7,877 | $625,000 | $335,000 | $290,000 |
| 2018 | $7,667 | $610,000 | $327,000 | $283,000 |
| 2017 | $7,510 | $595,000 | $319,000 | $276,000 |
| 2016 | $6,783 | $540,000 | $290,000 | $250,000 |
| 2015 | $6,619 | $525,000 | $282,000 | $243,000 |
| 2014 | $6,031 | $475,000 | $256,000 | $219,000 |
Source: Public Records
Map
Nearby Homes
- 7948 Cinthia St
- 7953 Cinthia St
- 7923 Cinthia St
- 4221 Cobalt Dr
- 4303 Sheldon Dr
- 4050 Rosarita Dr
- 4258 Summit Dr
- 7520 High St Unit 28-30
- 0 Eastridge Dr Unit WS21258579
- 8022 High St
- 7790 La Mesa Summit Dr
- 7795 La Mesa Summit Dr
- 7760 La Mesa Summit Dr
- 7765 La Mesa Summit Dr
- 4135 Olive Ave
- 8050-52 Lemon Grove Way
- 4415 Rosebud Ln
- 7810 La Mesa Summit Dr
- 4515 Acacia Ave
- 4504 Lee Ave
- 8040 Wetherley St
- 8020 Wetherley St
- 8045 Cinnabar Dr
- 8035 Cinnabar Dr
- 8055 Cinnabar Dr
- 8010 Wetherley St
- 8050 Wetherley St
- 8047 Wetherley St
- 8025 Cinnabar Dr
- 8027 Wetherley St
- 8000 Wetherley St
- 8065 Cinnabar Dr
- 4126 Eastridge Dr
- 8015 Cinnabar Dr
- 8017 Wetherley St
- 4156 Eastridge Dr
- 7980 Wetherley St
- 8075 Cinnabar Dr
- 8040 Cinnabar Dr
- 8030 Cinnabar Dr
Your Personal Tour Guide
Ask me questions while you tour the home.