Estimated Value: $136,000 - $199,000
--
Bed
1
Bath
1,194
Sq Ft
$132/Sq Ft
Est. Value
About This Home
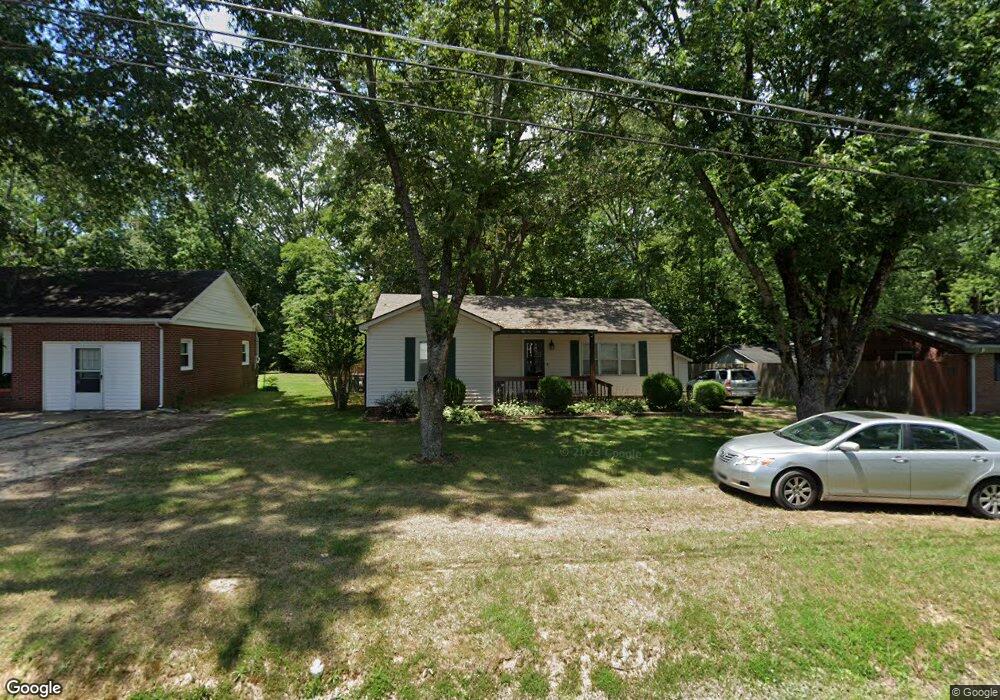
This home is located at 8031 Hillcrest Dr, Milan, TN 38358 and is currently estimated at $157,255, approximately $131 per square foot. 8031 Hillcrest Dr is a home located in Gibson County with nearby schools including Milan Elementary School, Milan Middle School, and Milan High School.
Ownership History
Date
Name
Owned For
Owner Type
Purchase Details
Closed on
Sep 21, 2023
Sold by
Brown Leonard Scott and Brown Amy Beth
Bought by
Brown Brandon and Brown Ashlyn
Current Estimated Value
Home Financials for this Owner
Home Financials are based on the most recent Mortgage that was taken out on this home.
Original Mortgage
$114,000
Outstanding Balance
$111,474
Interest Rate
6.96%
Mortgage Type
New Conventional
Estimated Equity
$45,781
Purchase Details
Closed on
Jul 29, 1995
Sold by
Vandiver Chris
Bought by
Brown Leonard Scott
Purchase Details
Closed on
Aug 14, 1993
Bought by
Vandiver Chris and Vandiver Jennifer
Purchase Details
Closed on
Mar 11, 1991
Bought by
Hemmat Mohammad Hosain and Hemmat Afsaneh
Purchase Details
Closed on
Dec 6, 1990
Bought by
Powell Lannie F and Powell Shirley J
Purchase Details
Closed on
Nov 13, 1990
Bought by
Clark William Thomas and Clark Suzanne M
Purchase Details
Closed on
Jun 15, 1966
Bought by
Clark Frank
Create a Home Valuation Report for This Property
The Home Valuation Report is an in-depth analysis detailing your home's value as well as a comparison with similar homes in the area
Home Values in the Area
Average Home Value in this Area
Purchase History
| Date | Buyer | Sale Price | Title Company |
|---|---|---|---|
| Brown Brandon | -- | None Listed On Document | |
| Brown Leonard Scott | $50,000 | -- | |
| Vandiver Chris | $41,000 | -- | |
| Hemmat Mohammad Hosain | $27,700 | -- | |
| Powell Lannie F | $15,000 | -- | |
| Clark William Thomas | -- | -- | |
| Clark Frank | -- | -- |
Source: Public Records
Mortgage History
| Date | Status | Borrower | Loan Amount |
|---|---|---|---|
| Open | Brown Brandon | $114,000 |
Source: Public Records
Tax History Compared to Growth
Tax History
| Year | Tax Paid | Tax Assessment Tax Assessment Total Assessment is a certain percentage of the fair market value that is determined by local assessors to be the total taxable value of land and additions on the property. | Land | Improvement |
|---|---|---|---|---|
| 2025 | $1,030 | $29,250 | $0 | $0 |
| 2024 | $1,030 | $29,250 | $3,500 | $25,750 |
| 2023 | $515 | $15,775 | $3,500 | $12,275 |
| 2022 | $504 | $15,775 | $3,500 | $12,275 |
| 2021 | $515 | $15,775 | $3,500 | $12,275 |
| 2020 | $768 | $15,775 | $3,500 | $12,275 |
| 2019 | $768 | $15,775 | $3,500 | $12,275 |
| 2018 | $620 | $13,775 | $3,500 | $10,275 |
| 2017 | $613 | $13,775 | $3,500 | $10,275 |
| 2016 | $613 | $13,775 | $3,500 | $10,275 |
| 2015 | $587 | $13,775 | $3,500 | $10,275 |
| 2014 | $587 | $13,775 | $3,500 | $10,275 |
Source: Public Records
Map
Nearby Homes
- 7086 Clemmer Dr
- 7085 Clemmer Dr
- 2006 Clemmer Dr
- 8006 S 1st St
- 9009 E Denney Dr
- 1095 Crestview Dr
- 7015 Dogwood Ln
- 1092 Brentwood Dr
- 2067 Brentwood Dr
- 10100 S 1st St
- 5050 Stinson St
- 6076 Belew Dr
- 5003 Dolly Tom Dr
- 4062 Ragsdale Dr
- 5006 Honeysuckle Ln
- 4032 Ragsdale Dr
- 5043 Kefauver Dr
- 4 Burrow Ln
- 5111 Rolling Meadows
- 12533 S 1st St
- 8023 Hillcrest Dr
- 8037 Hillcrest Dr
- 8015 Hillcrest Dr
- 8047 Hillcrest Dr
- 7126 Clemmer Dr
- 7116 Clemmer Dr
- 7140 Clemmer Dr
- 8040 Hillcrest Dr
- 8007 Hillcrest Dr
- 8020 Hillcrest Dr
- 7106 Clemmer Dr
- 8048 Hillcrest Dr
- 8061 Hillcrest Dr
- 8006 Hillcrest Dr
- 1080 Sunset Ridge
- 8001 Hillcrest Dr
- 7096 Clemmer Dr
- 1048 Sunset Ridge
- 7125 Clemmer Dr
- 7124 Hillcrest Dr