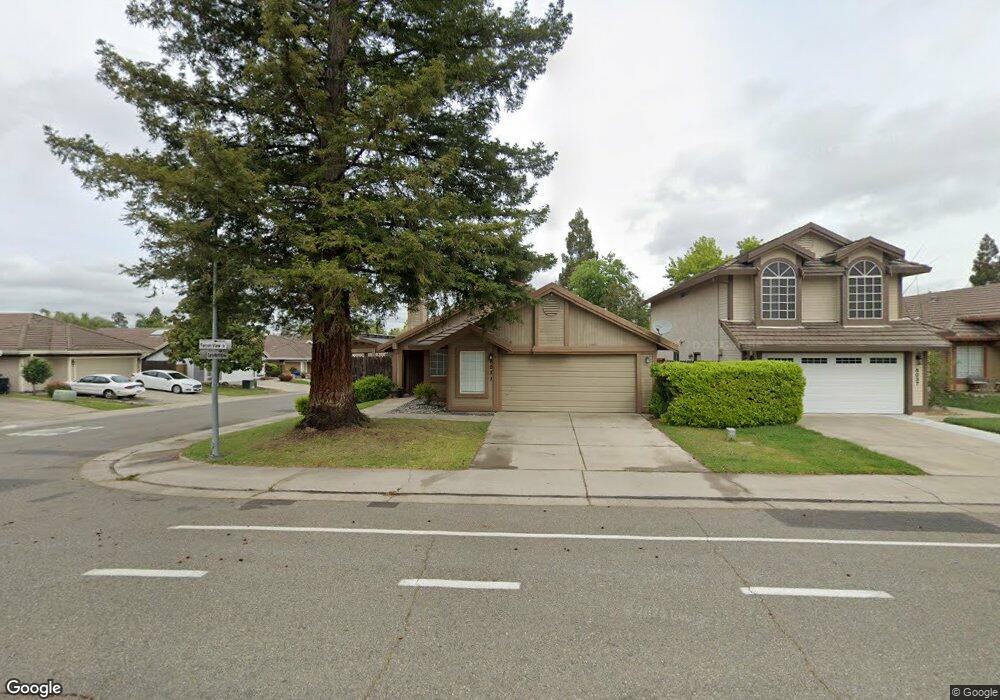
8033 Falcon View Dr Antelope, CA 95843
Estimated Value: $438,000 - $461,000
3
Beds
2
Baths
1,179
Sq Ft
$385/Sq Ft
Est. Value
About This Home
This home is located at 8033 Falcon View Dr, Antelope, CA 95843 and is currently estimated at $453,742, approximately $384 per square foot. 8033 Falcon View Dr is a home located in Sacramento County with nearby schools including Antelope Meadows Elementary School, Antelope Crossing Middle School, and Antelope High School.
Ownership History
Date
Name
Owned For
Owner Type
Purchase Details
Closed on
Jan 17, 2025
Sold by
Kurilko Vitaliy
Bought by
Kurilko Vitaliy and Kurilko Viktoriia
Current Estimated Value
Purchase Details
Closed on
Dec 14, 2011
Sold by
Kurilko Natalya
Bought by
Kurilko Vitaliy
Home Financials for this Owner
Home Financials are based on the most recent Mortgage that was taken out on this home.
Original Mortgage
$105,000
Interest Rate
3.94%
Mortgage Type
New Conventional
Purchase Details
Closed on
Nov 21, 2011
Sold by
U S Bank National Association
Bought by
Kurilko Vitaliy
Home Financials for this Owner
Home Financials are based on the most recent Mortgage that was taken out on this home.
Original Mortgage
$105,000
Interest Rate
3.94%
Mortgage Type
New Conventional
Purchase Details
Closed on
Aug 31, 2011
Sold by
Wilson Mark and Wilson Mary
Bought by
U S Bank National Association
Create a Home Valuation Report for This Property
The Home Valuation Report is an in-depth analysis detailing your home's value as well as a comparison with similar homes in the area
Home Values in the Area
Average Home Value in this Area
Purchase History
| Date | Buyer | Sale Price | Title Company |
|---|---|---|---|
| Kurilko Vitaliy | -- | None Listed On Document | |
| Kurilko Vitaliy | -- | None Listed On Document | |
| Kurilko Vitaliy | -- | Chicago Title Company | |
| Kurilko Vitaliy | $140,000 | Chicago Title Company | |
| U S Bank National Association | $387,231 | Accommodation |
Source: Public Records
Mortgage History
| Date | Status | Borrower | Loan Amount |
|---|---|---|---|
| Previous Owner | Kurilko Vitaliy | $105,000 |
Source: Public Records
Tax History
| Year | Tax Paid | Tax Assessment Tax Assessment Total Assessment is a certain percentage of the fair market value that is determined by local assessors to be the total taxable value of land and additions on the property. | Land | Improvement |
|---|---|---|---|---|
| 2025 | $1,918 | $175,835 | $94,198 | $81,637 |
| 2024 | $1,918 | $172,388 | $92,351 | $80,037 |
| 2023 | $1,897 | $169,009 | $90,541 | $78,468 |
| 2022 | $1,897 | $165,696 | $88,766 | $76,930 |
| 2021 | $1,905 | $162,448 | $87,026 | $75,422 |
| 2020 | $1,889 | $160,783 | $86,134 | $74,649 |
| 2019 | $1,862 | $157,632 | $84,446 | $73,186 |
| 2018 | $1,797 | $154,542 | $82,791 | $71,751 |
| 2017 | $1,771 | $151,513 | $81,168 | $70,345 |
| 2016 | $1,726 | $148,543 | $79,577 | $68,966 |
| 2015 | $1,696 | $146,313 | $78,382 | $67,931 |
| 2014 | $2,289 | $143,448 | $76,847 | $66,601 |
Source: Public Records
Map
Nearby Homes
- 4726 Careo Dr
- 4632 Swindon Way
- 7929 Titan Dr
- 5136 Rosbury Dell Place
- 7856 Crestleigh Ct
- 8644 Travary Way
- 4809 Winter Oak Way
- 8657 Meandering Way
- 8233 Dalkeith Way
- 8020 Walerga Rd Unit 3
- 8020 Walerga Rd
- 8020 Walerga Rd Unit 1009
- 8020 Walerga Rd Unit 1093
- 8020 Walerga Rd
- 8573 Meandering Way
- 8509 Twin Trails Dr
- 8121 Deer Spring Cir
- 8434 Walerga Rd Unit 327
- 8434 Walerga Rd Unit 128
- 7666 Ocean Park Dr
- 8037 Falcon View Dr
- 8110 Early Morning Way
- 8041 Falcon View Dr
- 8105 Early Morning Way
- 8101 Early Morning Way
- 8045 Falcon View Dr
- 8109 Early Morning Way
- 8134 Early Morning Way
- 8138 Early Morning Way
- 8032 Falcon View Dr
- 8113 Early Morning Way
- 8142 Early Morning Way
- 8101 Falcon View Dr
- 8042 Falcon View Dr
- 8026 Falcon View Dr
- 8146 Early Morning Way
- 8117 Early Morning Way
- 8046 Falcon View Dr
- 8105 Falcon View Dr
- 8022 Falcon View Dr
Your Personal Tour Guide
Ask me questions while you tour the home.