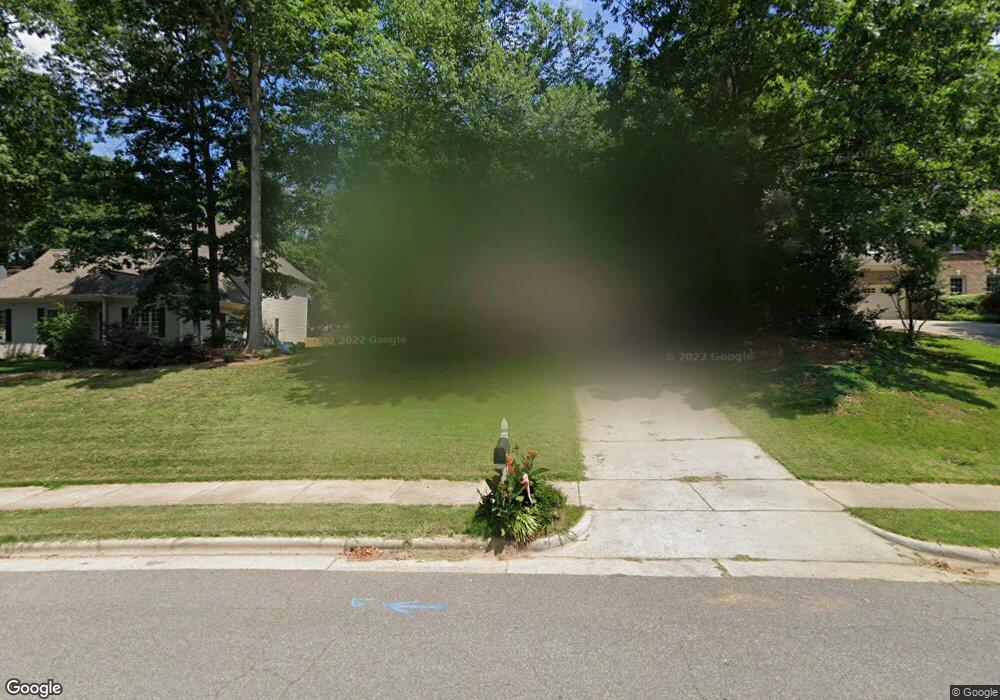
8033 Gabriels Bend Dr Raleigh, NC 27612
Estimated Value: $662,945 - $758,000
3
Beds
3
Baths
2,407
Sq Ft
$293/Sq Ft
Est. Value
About This Home
This home is located at 8033 Gabriels Bend Dr, Raleigh, NC 27612 and is currently estimated at $704,986, approximately $292 per square foot. 8033 Gabriels Bend Dr is a home located in Wake County with nearby schools including Leesville Road Elementary School, Leesville Road Middle School, and Leesville Road High School.
Ownership History
Date
Name
Owned For
Owner Type
Purchase Details
Closed on
Jun 30, 2011
Sold by
Ohlsson Dawn Renee Huey and Burgess Shannon Lamar
Bought by
Brolley Eric Daniel and Brolley Sarah Nelson
Current Estimated Value
Home Financials for this Owner
Home Financials are based on the most recent Mortgage that was taken out on this home.
Original Mortgage
$256,800
Outstanding Balance
$177,668
Interest Rate
4.63%
Mortgage Type
New Conventional
Estimated Equity
$527,318
Purchase Details
Closed on
Jan 21, 2010
Sold by
Ohlsson Magnus Christian and Ohlsson Dawn Renee Huey
Bought by
Ohlsson Dawn Renee Huey
Purchase Details
Closed on
Nov 15, 2004
Sold by
Woods Derek M and Woods Michelle K
Bought by
Ohlsson Magnus Christian and Ohlsson Dawn Renee Huey
Home Financials for this Owner
Home Financials are based on the most recent Mortgage that was taken out on this home.
Original Mortgage
$229,500
Interest Rate
5.6%
Mortgage Type
Purchase Money Mortgage
Create a Home Valuation Report for This Property
The Home Valuation Report is an in-depth analysis detailing your home's value as well as a comparison with similar homes in the area
Home Values in the Area
Average Home Value in this Area
Purchase History
| Date | Buyer | Sale Price | Title Company |
|---|---|---|---|
| Brolley Eric Daniel | $321,000 | None Available | |
| Ohlsson Dawn Renee Huey | -- | None Available | |
| Ohlsson Magnus Christian | $287,000 | -- |
Source: Public Records
Mortgage History
| Date | Status | Borrower | Loan Amount |
|---|---|---|---|
| Open | Brolley Eric Daniel | $256,800 | |
| Previous Owner | Ohlsson Magnus Christian | $229,500 | |
| Closed | Ohlsson Magnus Christian | $28,600 |
Source: Public Records
Tax History Compared to Growth
Tax History
| Year | Tax Paid | Tax Assessment Tax Assessment Total Assessment is a certain percentage of the fair market value that is determined by local assessors to be the total taxable value of land and additions on the property. | Land | Improvement |
|---|---|---|---|---|
| 2025 | $5,397 | $616,512 | $240,000 | $376,512 |
| 2024 | $5,374 | $616,512 | $240,000 | $376,512 |
| 2023 | $4,557 | $416,276 | $105,000 | $311,276 |
| 2022 | $4,235 | $416,276 | $105,000 | $311,276 |
| 2021 | $4,070 | $416,276 | $105,000 | $311,276 |
| 2020 | $3,996 | $416,276 | $105,000 | $311,276 |
| 2019 | $4,100 | $352,019 | $105,000 | $247,019 |
| 2018 | $3,866 | $352,019 | $105,000 | $247,019 |
| 2017 | $3,682 | $352,019 | $105,000 | $247,019 |
| 2016 | $3,606 | $360,298 | $105,000 | $255,298 |
| 2015 | $3,671 | $352,556 | $120,000 | $232,556 |
| 2014 | $3,481 | $352,556 | $120,000 | $232,556 |
Source: Public Records
Map
Nearby Homes
- 8004 Looking Glass Ct
- 8016 Sycamore Hill Ln
- 8032 Sycamore Hill Ln
- 8719 Cypress Grove Run
- 8025 Goldenrain Way
- 8741 Cypress Grove
- 8118 Primanti Blvd
- 7504 Panther Branch Dr
- 8823 Orchard Grove Way
- 8106 Sommerwell St
- 8511 Bright Loop
- 8143 Rhiannon Rd
- 5606 Berry Creek Cir
- 8512 Silsbee Dr
- 5634 Berry Creek Cir
- 7705 Jackson Dane Dr
- 8219 Martello Ln
- 8209 Shadow Stone Ct
- 8253 City Loft Ct
- 7226 Corvette Ct
- 8037 Gabriels Bend Dr
- 8029 Gabriels Bend Dr
- 7647 Astoria Place Unit 14C
- 7645 Astoria Place Unit 14D
- 7649 Astoria Place
- 8025 Gabriels Bend Dr
- 7641 Astoria Place
- 8041 Gabriels Bend Dr
- 7651 Astoria Place Unit 14A
- 7639 Astoria Place Unit 13B
- 7637 Astoria Place
- 7701 Astoria Place
- 7635 Astoria Place
- 8032 Gabriels Bend Dr
- 7703 Astoria Place
- 8205 Nolichucky Ct
- 8024 Gabriels Bend Dr
- 8040 Gabriels Bend Dr
- 7631 Astoria Place
- 8021 Gabriels Bend Dr