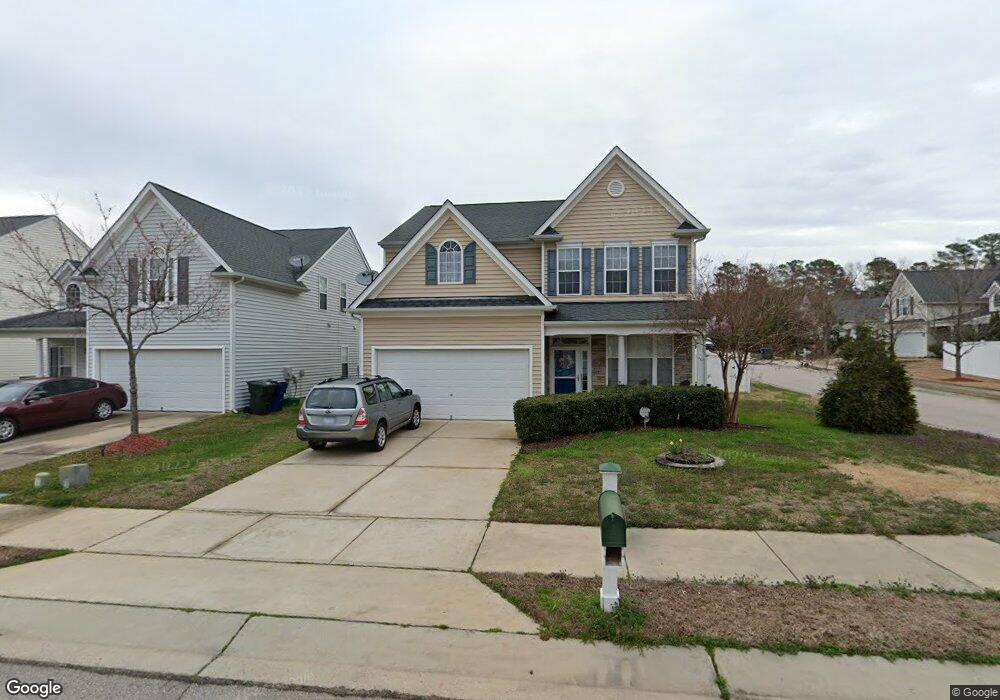
8034 Marsh Hollow Dr Raleigh, NC 27616
Forestville NeighborhoodEstimated Value: $408,000 - $441,000
4
Beds
3
Baths
2,227
Sq Ft
$188/Sq Ft
Est. Value
About This Home
This home is located at 8034 Marsh Hollow Dr, Raleigh, NC 27616 and is currently estimated at $418,639, approximately $187 per square foot. 8034 Marsh Hollow Dr is a home located in Wake County with nearby schools including Harris Creek Elementary School, Rolesville Middle School, and Rolesville High School.
Ownership History
Date
Name
Owned For
Owner Type
Purchase Details
Closed on
Sep 3, 2024
Sold by
Romo Ernesto Ballin
Bought by
Sanganuruu Winyn
Current Estimated Value
Home Financials for this Owner
Home Financials are based on the most recent Mortgage that was taken out on this home.
Original Mortgage
$450,000
Outstanding Balance
$439,004
Interest Rate
6.77%
Mortgage Type
New Conventional
Estimated Equity
-$20,365
Purchase Details
Closed on
Sep 19, 2014
Sold by
Herbert Richard E and Herbert Lenore A P
Bought by
Romo Ernesto Ballin
Home Financials for this Owner
Home Financials are based on the most recent Mortgage that was taken out on this home.
Original Mortgage
$194,190
Interest Rate
4.15%
Mortgage Type
New Conventional
Purchase Details
Closed on
Nov 7, 2003
Sold by
Murdock & Gannon Construction Inc
Bought by
Herbert Richard E and Herbert Lenore A P
Home Financials for this Owner
Home Financials are based on the most recent Mortgage that was taken out on this home.
Original Mortgage
$166,359
Interest Rate
6%
Mortgage Type
Purchase Money Mortgage
Create a Home Valuation Report for This Property
The Home Valuation Report is an in-depth analysis detailing your home's value as well as a comparison with similar homes in the area
Home Values in the Area
Average Home Value in this Area
Purchase History
| Date | Buyer | Sale Price | Title Company |
|---|---|---|---|
| Sanganuruu Winyn | $450,000 | None Listed On Document | |
| Romo Ernesto Ballin | $195,000 | None Available | |
| Herbert Richard E | $175,500 | -- |
Source: Public Records
Mortgage History
| Date | Status | Borrower | Loan Amount |
|---|---|---|---|
| Open | Sanganuruu Winyn | $450,000 | |
| Previous Owner | Romo Ernesto Ballin | $194,190 | |
| Previous Owner | Herbert Richard E | $166,359 |
Source: Public Records
Tax History Compared to Growth
Tax History
| Year | Tax Paid | Tax Assessment Tax Assessment Total Assessment is a certain percentage of the fair market value that is determined by local assessors to be the total taxable value of land and additions on the property. | Land | Improvement |
|---|---|---|---|---|
| 2025 | $3,189 | $363,351 | $90,000 | $273,351 |
| 2024 | $3,176 | $363,351 | $90,000 | $273,351 |
| 2023 | $2,713 | $247,056 | $45,000 | $202,056 |
| 2022 | $2,521 | $247,056 | $45,000 | $202,056 |
| 2021 | $2,424 | $247,056 | $45,000 | $202,056 |
| 2020 | $2,380 | $247,056 | $45,000 | $202,056 |
| 2019 | $2,257 | $193,020 | $45,000 | $148,020 |
| 2018 | $2,129 | $193,020 | $45,000 | $148,020 |
| 2017 | $2,028 | $193,020 | $45,000 | $148,020 |
| 2016 | $1,986 | $193,020 | $45,000 | $148,020 |
| 2015 | $2,039 | $194,984 | $44,000 | $150,984 |
| 2014 | $1,934 | $194,984 | $44,000 | $150,984 |
Source: Public Records
Map
Nearby Homes
- 7528 Argent Valley Dr
- 3904 Leeson Trail
- 8005 Caliber Woods Dr
- 8117 Bright Oak Trail
- 4017 Rothfield Ln
- 8520 Quarton Dr
- 3617 Jordan Mill Ct
- 3605 Iron Sight Ct
- 4007 Newell Ln
- 3665 Watkins Ridge Ct
- 8341 Hollister Hills Dr
- 2821 Casona Way
- 4220 Bay Laurel Ct
- Taylorsville Plan at Watkins Glen
- Johnson Plan at Watkins Glen
- Sherwood Plan at Watkins Glen
- Chatham Plan at Watkins Glen
- 4028 Wesley Chapel Way
- 4140 Stells Rd
- 3814 Tyler Bluff Ln
- 8038 Marsh Hollow Dr
- 7813 Wrightwood Dr
- 8026 Marsh Hollow Dr
- 8042 Marsh Hollow Dr
- 7817 Wrightwood Dr
- 7814 Braefield Dr
- 8046 Marsh Hollow Dr
- 8035 Marsh Hollow Dr
- 7814 Wrightwood Dr
- 8039 Marsh Hollow Dr
- 8022 Marsh Hollow Dr
- 7821 Wrightwood Dr
- 8031 Marsh Hollow Dr
- 8043 Marsh Hollow Dr
- 7818 Braefield Dr
- 8027 Marsh Hollow Dr
- 8014 Marsh Hollow Dr
- 8047 Marsh Hollow Dr
- 8023 Willowglen Dr
- 8023 Marsh Hollow Dr