Estimated Value: $355,000 - $540,000
3
Beds
2
Baths
1,227
Sq Ft
$373/Sq Ft
Est. Value
About This Home
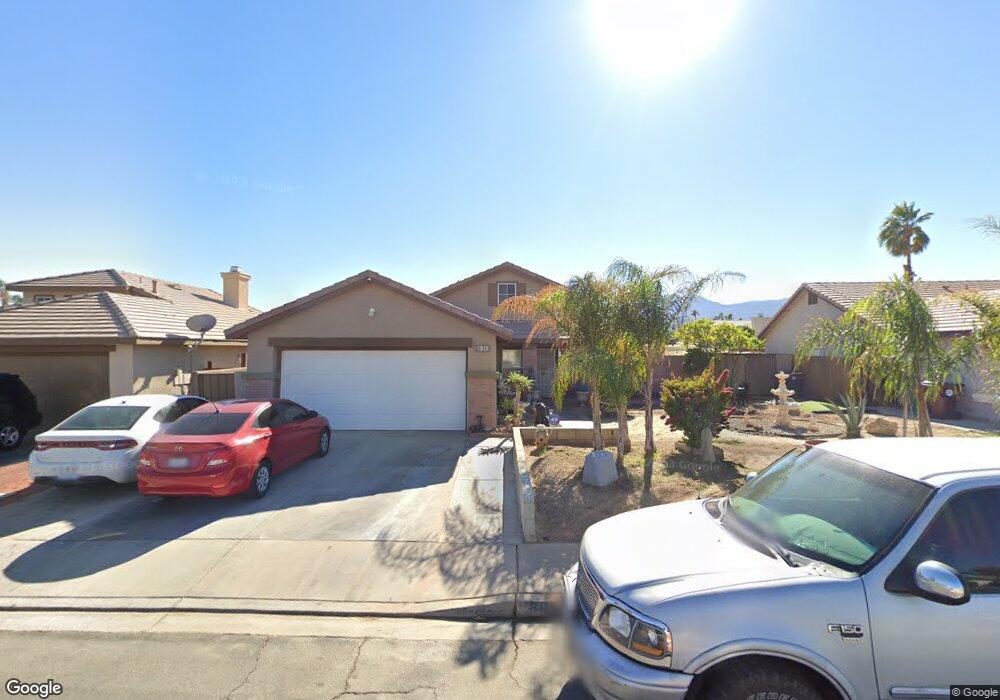
This home is located at 80343 Windsong Way, Indio, CA 92201 and is currently estimated at $457,551, approximately $372 per square foot. 80343 Windsong Way is a home located in Riverside County with nearby schools including James Madison Elementary School, Indio Middle School, and Indio High School.
Ownership History
Date
Name
Owned For
Owner Type
Purchase Details
Closed on
Sep 23, 2024
Sold by
Huffman Tina
Bought by
Vallier Tamara and Vallier Donald
Current Estimated Value
Purchase Details
Closed on
Jan 30, 2001
Sold by
Huffman James Ray
Bought by
Huffman James Ray and Huffman Tina Lafaye
Purchase Details
Closed on
Apr 1, 1998
Sold by
Jackson Odilia H
Bought by
Huffman James Ray
Home Financials for this Owner
Home Financials are based on the most recent Mortgage that was taken out on this home.
Original Mortgage
$88,420
Interest Rate
7.05%
Mortgage Type
FHA
Purchase Details
Closed on
Jul 1, 1993
Sold by
Kaufman & Broad Of Southern California I
Bought by
Jackson Odilia H
Home Financials for this Owner
Home Financials are based on the most recent Mortgage that was taken out on this home.
Original Mortgage
$98,931
Interest Rate
7.34%
Mortgage Type
FHA
Create a Home Valuation Report for This Property
The Home Valuation Report is an in-depth analysis detailing your home's value as well as a comparison with similar homes in the area
Home Values in the Area
Average Home Value in this Area
Purchase History
| Date | Buyer | Sale Price | Title Company |
|---|---|---|---|
| Vallier Tamara | -- | None Listed On Document | |
| Huffman James Ray | -- | -- | |
| Huffman James Ray | $89,000 | Commonwealth Land Title Co | |
| Jackson Odilia H | $99,000 | First American Title Insuran |
Source: Public Records
Mortgage History
| Date | Status | Borrower | Loan Amount |
|---|---|---|---|
| Previous Owner | Huffman James Ray | $88,420 | |
| Previous Owner | Jackson Odilia H | $98,931 |
Source: Public Records
Tax History Compared to Growth
Tax History
| Year | Tax Paid | Tax Assessment Tax Assessment Total Assessment is a certain percentage of the fair market value that is determined by local assessors to be the total taxable value of land and additions on the property. | Land | Improvement |
|---|---|---|---|---|
| 2025 | $2,925 | $485,000 | $125,000 | $360,000 |
| 2023 | $2,925 | $136,561 | $38,352 | $98,209 |
| 2022 | $2,636 | $133,884 | $37,600 | $96,284 |
| 2021 | $2,668 | $131,260 | $36,863 | $94,397 |
| 2020 | $2,251 | $129,916 | $36,486 | $93,430 |
| 2019 | $2,188 | $127,370 | $35,771 | $91,599 |
| 2018 | $2,130 | $124,873 | $35,071 | $89,802 |
| 2017 | $2,093 | $122,426 | $34,384 | $88,042 |
| 2016 | $2,064 | $120,026 | $33,710 | $86,316 |
| 2015 | $2,022 | $118,224 | $33,204 | $85,020 |
| 2014 | $2,010 | $115,909 | $32,554 | $83,355 |
Source: Public Records
Map
Nearby Homes
- 46293 Willow Ln
- 80472 Suncastle Rd
- 80173 Palm Circle Dr
- 80205 Westward ho Dr
- 80100 Vista Grande
- 80222 Spanish Bay Dr
- 80748 Cottonwood Ln
- 80173 Golden Horseshoe Dr
- 45703 Spyglass Hill St
- 80870 Us Highway 111 Spc 207
- 79955 Westward ho Dr
- 45846 Big Canyon St
- 80870 California 111
- 80870 California 111 Unit 5
- 80870 California 111 Unit 119
- 80295 Green Hills Dr
- 47412 Manteca Ct
- 47340 Jefferson St Unit 289
- 80424 Green Hills Dr
- 80890 California 111
- 80331 Windsong Way
- 80355 Windsong Way
- 80336 Moonshadow Dr
- 80348 Moonshadow Dr
- 80371 Windsong Way
- 80322 Moonshadow Dr
- 80362 Moonshadow Dr
- 80319 Windsong Way
- 80342 Windsong Way
- 80356 Windsong Way
- 80308 Moonshadow Dr
- 80374 Moonshadow Dr
- 80381 Windsong Way
- 80368 Windsong Way
- 80330 Windsong Way
- 80313 Windsong Way
- 80292 Moonshadow Dr
- 80318 Windsong Way
- 80382 Windsong Way
- 80347 Moonshadow Dr