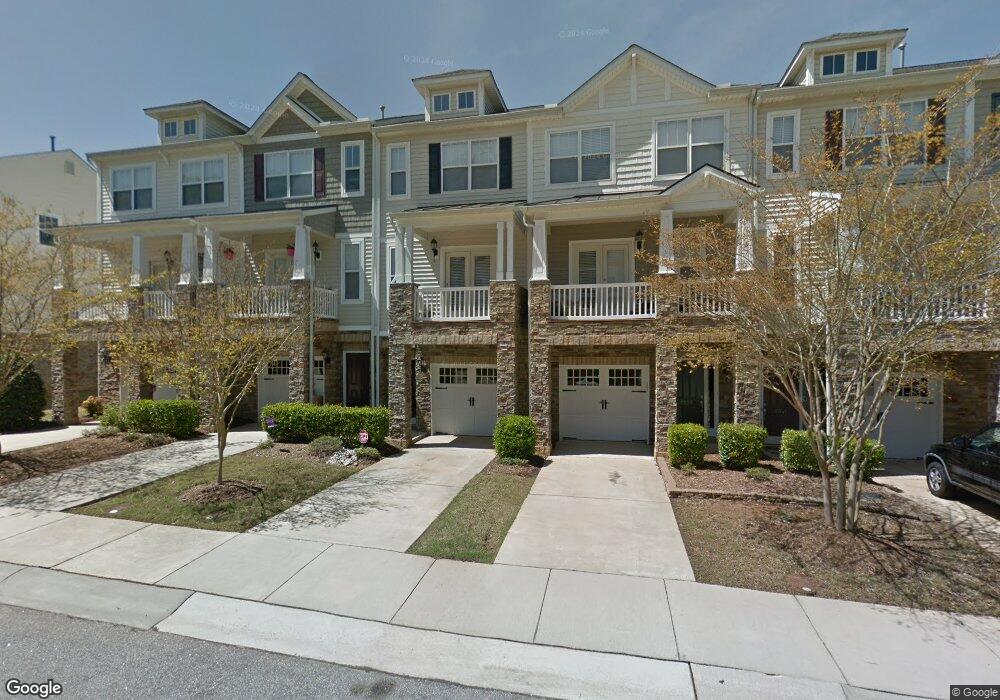
8037 Sycamore Hill Ln Raleigh, NC 27612
Umstead NeighborhoodEstimated Value: $340,349 - $351,000
2
Beds
3
Baths
1,536
Sq Ft
$226/Sq Ft
Est. Value
About This Home
This home is located at 8037 Sycamore Hill Ln, Raleigh, NC 27612 and is currently estimated at $347,337, approximately $226 per square foot. 8037 Sycamore Hill Ln is a home located in Wake County with nearby schools including Leesville Road Elementary School, Leesville Road Middle School, and Leesville Road High School.
Ownership History
Date
Name
Owned For
Owner Type
Purchase Details
Closed on
Apr 18, 2014
Sold by
Staffen Keith W and Brafman Jennifer S
Bought by
Brown Deirdre
Current Estimated Value
Home Financials for this Owner
Home Financials are based on the most recent Mortgage that was taken out on this home.
Original Mortgage
$132,600
Outstanding Balance
$100,915
Interest Rate
4.37%
Mortgage Type
New Conventional
Estimated Equity
$246,422
Purchase Details
Closed on
Feb 27, 2007
Sold by
Beazer Homes Corp
Bought by
Staffen Keith W
Home Financials for this Owner
Home Financials are based on the most recent Mortgage that was taken out on this home.
Original Mortgage
$166,800
Interest Rate
6.16%
Mortgage Type
Unknown
Purchase Details
Closed on
Oct 3, 2006
Sold by
Ebenezer Church Road Llc
Bought by
Beazer Homes Corp
Create a Home Valuation Report for This Property
The Home Valuation Report is an in-depth analysis detailing your home's value as well as a comparison with similar homes in the area
Home Values in the Area
Average Home Value in this Area
Purchase History
| Date | Buyer | Sale Price | Title Company |
|---|---|---|---|
| Brown Deirdre | $166,000 | None Available | |
| Staffen Keith W | $208,500 | None Available | |
| Beazer Homes Corp | $772,500 | None Available |
Source: Public Records
Mortgage History
| Date | Status | Borrower | Loan Amount |
|---|---|---|---|
| Open | Brown Deirdre | $132,600 | |
| Previous Owner | Staffen Keith W | $166,800 |
Source: Public Records
Tax History Compared to Growth
Tax History
| Year | Tax Paid | Tax Assessment Tax Assessment Total Assessment is a certain percentage of the fair market value that is determined by local assessors to be the total taxable value of land and additions on the property. | Land | Improvement |
|---|---|---|---|---|
| 2025 | $2,863 | $326,038 | $90,000 | $236,038 |
| 2024 | $2,852 | $326,038 | $90,000 | $236,038 |
| 2023 | $2,371 | $215,644 | $45,000 | $170,644 |
| 2022 | $2,203 | $215,644 | $45,000 | $170,644 |
| 2021 | $2,118 | $215,644 | $45,000 | $170,644 |
| 2020 | $2,080 | $215,644 | $45,000 | $170,644 |
| 2019 | $1,990 | $170,021 | $40,000 | $130,021 |
| 2018 | $1,878 | $170,021 | $40,000 | $130,021 |
| 2017 | $1,789 | $170,021 | $40,000 | $130,021 |
| 2016 | $1,752 | $170,021 | $40,000 | $130,021 |
| 2015 | $1,839 | $175,687 | $39,000 | $136,687 |
| 2014 | $1,745 | $175,687 | $39,000 | $136,687 |
Source: Public Records
Map
Nearby Homes
- 8719 Cypress Grove Run
- 8032 Sycamore Hill Ln
- 8729 Cypress Grove Run
- 8020 Goldenrain Way
- 8016 Sycamore Hill Ln
- 8005 Sycamore Hill Ln
- 7710 Astoria Place
- 8815 Orchard Grove Way
- 8511 Bright Loop
- 8512 Silsbee Dr
- 8204 Pilots View Dr
- 8118 Primanti Blvd
- 8245 Martello Ln
- 8303 Deckbar Place
- 8253 Martello Ln
- 7705 Jackson Dane Dr
- 8325 Pilots View Dr
- 8412 Pilots View Dr
- 6709 W Lake Anne Dr
- 8517 Stonechase Dr
- 8039 Sycamore Hill Ln
- 8041 Sycamore Hill Ln
- 8043 Sycamore Hill Ln
- 8035 Sycamore Hill Ln
- 8045 Sycamore Hill Ln
- 8033 Sycamore Hill Ln
- 8713 Cypress Grove Run
- 8029 Sycamore Hill Ln
- 8715 Cypress Grove Run
- 8717 Cypress Grove Run
- 8027 Sycamore Hill Ln
- 8038 Sycamore Hill Ln
- 8040 Sycamore Hill Ln
- 8042 Sycamore Hill Ln
- 8036 Sycamore Hill Ln
- 8044 Sycamore Hill Ln
- 8034 Sycamore Hill Ln
- 8025 Sycamore Hill Ln
- 8721 Cypress Grove Run
- 8030 Sycamore Hill Ln