Estimated Value: $563,575 - $639,000
4
Beds
3
Baths
1,924
Sq Ft
$307/Sq Ft
Est. Value
About This Home
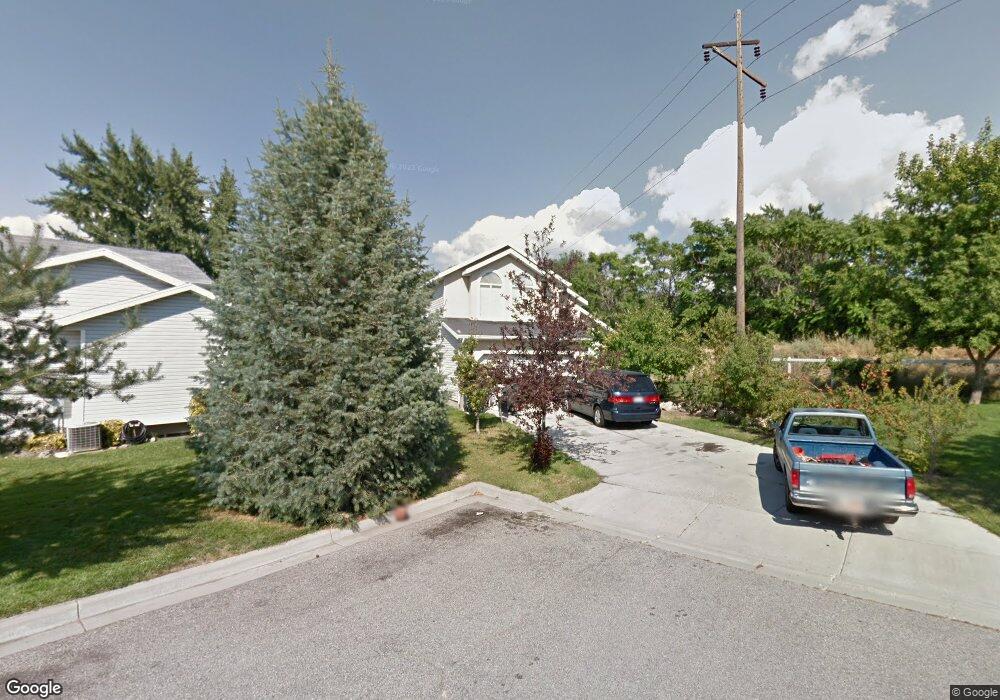
This home is located at 8039 S 420 E, Sandy, UT 84070 and is currently estimated at $591,144, approximately $307 per square foot. 8039 S 420 E is a home located in Salt Lake County with nearby schools including Midvalley Elementary School, Union Middle School, and Hillcrest High School.
Ownership History
Date
Name
Owned For
Owner Type
Purchase Details
Closed on
Jan 2, 2001
Sold by
Mcallister Bernardine E and Mcallister Carole E
Bought by
Melendrez Juana and Yanagui Nolberto
Current Estimated Value
Home Financials for this Owner
Home Financials are based on the most recent Mortgage that was taken out on this home.
Original Mortgage
$170,700
Outstanding Balance
$63,758
Interest Rate
7.71%
Estimated Equity
$527,386
Purchase Details
Closed on
Aug 18, 1998
Sold by
Strang Robert B and Strang Connie M
Bought by
Mcallister Bernardine E and Mcallister Carole E
Purchase Details
Closed on
Jan 8, 1996
Sold by
Strang Robert B
Bought by
Strang Robert B and Strang Connie M
Home Financials for this Owner
Home Financials are based on the most recent Mortgage that was taken out on this home.
Original Mortgage
$106,750
Interest Rate
6.87%
Purchase Details
Closed on
Mar 21, 1995
Sold by
Strang Robert B and Olson Kevin S
Bought by
Strang Robert B
Create a Home Valuation Report for This Property
The Home Valuation Report is an in-depth analysis detailing your home's value as well as a comparison with similar homes in the area
Home Values in the Area
Average Home Value in this Area
Purchase History
| Date | Buyer | Sale Price | Title Company |
|---|---|---|---|
| Melendrez Juana | -- | Superior Title | |
| Mcallister Bernardine E | -- | -- | |
| Strang Robert B | -- | -- | |
| Strang Robert B | -- | -- |
Source: Public Records
Mortgage History
| Date | Status | Borrower | Loan Amount |
|---|---|---|---|
| Open | Melendrez Juana | $170,700 | |
| Previous Owner | Strang Robert B | $106,750 |
Source: Public Records
Tax History
| Year | Tax Paid | Tax Assessment Tax Assessment Total Assessment is a certain percentage of the fair market value that is determined by local assessors to be the total taxable value of land and additions on the property. | Land | Improvement |
|---|---|---|---|---|
| 2025 | $2,758 | $515,000 | $144,600 | $370,400 |
| 2024 | $2,758 | $509,400 | $135,200 | $374,200 |
| 2023 | $2,558 | $471,200 | $128,500 | $342,700 |
| 2022 | $2,654 | $478,100 | $126,000 | $352,100 |
| 2021 | $2,479 | $379,400 | $107,700 | $271,700 |
| 2020 | $2,304 | $332,800 | $107,700 | $225,100 |
| 2019 | $2,241 | $315,200 | $101,600 | $213,600 |
| 2016 | $1,852 | $250,600 | $101,600 | $149,000 |
Source: Public Records
Map
Nearby Homes
- 393 E Corral Creek Dr
- 379 E Horse Creek Dr
- 8087 S 615 E
- 274 E Water Mill Way Unit 230
- 257 Water Mill Way Unit 211
- 257 E Water Mill Way
- 397 E Tractor Dr Unit 103
- 8322 S Levine Ln Unit 111
- 7824 S 280 E
- 190 E White Spruce Cove Unit 805
- 760 E 8080 S
- 7869 S 700 E
- 8023 S Pinewood Dr
- 359 E 8400 S
- 135 E Station St
- 144 E Chambord Ct
- 600 E Briarsprings Cir
- 8459 S 300 E
- 8264 S Resaca Dr Unit K9
- 8278 S Resaca Dr Unit L1
Your Personal Tour Guide
Ask me questions while you tour the home.