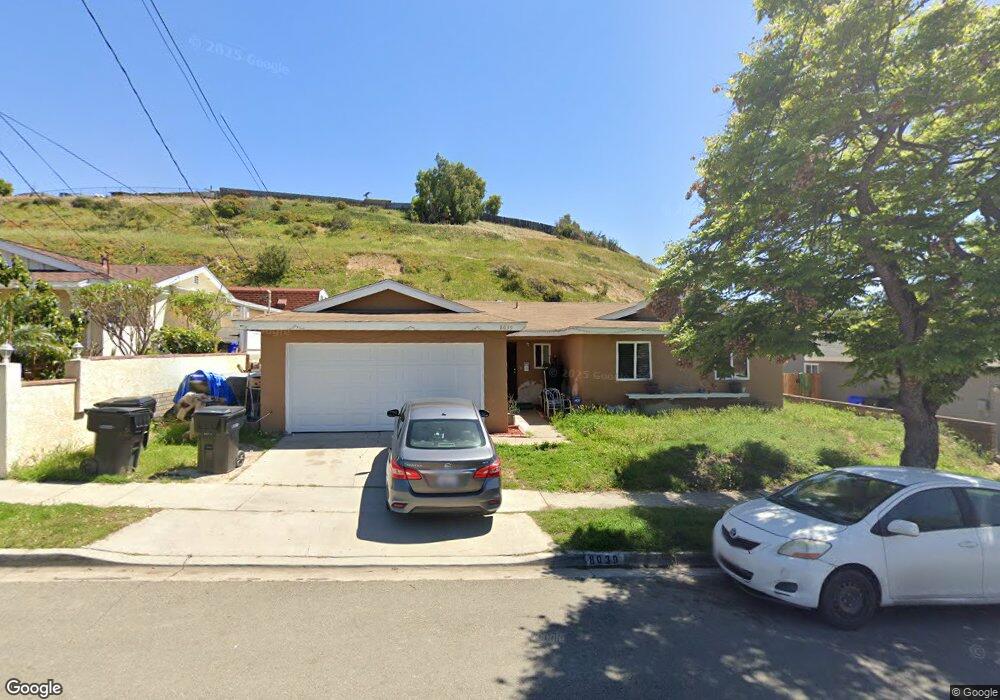
8039 San Felipe St San Diego, CA 92114
Jamacha Lomita NeighborhoodEstimated Value: $635,000 - $697,000
3
Beds
2
Baths
964
Sq Ft
$688/Sq Ft
Est. Value
About This Home
This home is located at 8039 San Felipe St, San Diego, CA 92114 and is currently estimated at $663,688, approximately $688 per square foot. 8039 San Felipe St is a home located in San Diego County with nearby schools including Audubon K-8, Bell Middle School, and Morse High School.
Ownership History
Date
Name
Owned For
Owner Type
Purchase Details
Closed on
Mar 4, 2015
Sold by
Finnerson Danny L and Finnerson Latasha M
Bought by
Finnerson Danny L
Current Estimated Value
Home Financials for this Owner
Home Financials are based on the most recent Mortgage that was taken out on this home.
Original Mortgage
$170,000
Outstanding Balance
$129,672
Interest Rate
3.57%
Mortgage Type
New Conventional
Estimated Equity
$534,016
Purchase Details
Closed on
Feb 21, 2003
Sold by
Finnerson Danny L and Thompson Charles E
Bought by
Finnerson Danny L
Purchase Details
Closed on
Mar 4, 1999
Sold by
Brauburger Investment Corp
Bought by
Finnerson Danny L and Thompson Charles E
Home Financials for this Owner
Home Financials are based on the most recent Mortgage that was taken out on this home.
Original Mortgage
$121,984
Interest Rate
6.79%
Mortgage Type
FHA
Purchase Details
Closed on
Oct 17, 1997
Sold by
Stephen Mcintosh
Bought by
Brauburger Investment Corp
Home Financials for this Owner
Home Financials are based on the most recent Mortgage that was taken out on this home.
Original Mortgage
$40,000
Interest Rate
7.49%
Create a Home Valuation Report for This Property
The Home Valuation Report is an in-depth analysis detailing your home's value as well as a comparison with similar homes in the area
Home Values in the Area
Average Home Value in this Area
Purchase History
| Date | Buyer | Sale Price | Title Company |
|---|---|---|---|
| Finnerson Danny L | -- | Fidelity National Title | |
| Finnerson Danny L | -- | North American Title Co | |
| Finnerson Danny L | $123,000 | Southland Title | |
| Brauburger Investment Corp | $37,000 | Southland Title |
Source: Public Records
Mortgage History
| Date | Status | Borrower | Loan Amount |
|---|---|---|---|
| Open | Finnerson Danny L | $170,000 | |
| Closed | Finnerson Danny L | $121,984 | |
| Previous Owner | Brauburger Investment Corp | $40,000 |
Source: Public Records
Tax History Compared to Growth
Tax History
| Year | Tax Paid | Tax Assessment Tax Assessment Total Assessment is a certain percentage of the fair market value that is determined by local assessors to be the total taxable value of land and additions on the property. | Land | Improvement |
|---|---|---|---|---|
| 2025 | $2,356 | $192,796 | $107,109 | $85,687 |
| 2024 | $2,356 | $189,016 | $105,009 | $84,007 |
| 2023 | $2,304 | $185,310 | $102,950 | $82,360 |
| 2022 | $2,243 | $181,678 | $100,932 | $80,746 |
| 2021 | $2,228 | $178,116 | $98,953 | $79,163 |
| 2020 | $2,201 | $176,291 | $97,939 | $78,352 |
| 2019 | $2,162 | $172,835 | $96,019 | $76,816 |
| 2018 | $2,023 | $169,447 | $94,137 | $75,310 |
| 2017 | $80 | $166,126 | $92,292 | $73,834 |
| 2016 | $1,860 | $162,870 | $90,483 | $72,387 |
| 2015 | $1,832 | $160,424 | $89,124 | $71,300 |
| 2014 | $1,802 | $157,283 | $87,379 | $69,904 |
Source: Public Records
Map
Nearby Homes
- 284 Middlebush Dr
- 249 Meadowbrook Dr
- 7936 Pala St
- 8017 Gribble St
- 101 Coolwater Dr
- 7853 Gribble St
- 612 Cardiff St
- 256 S Royal Oak Dr
- 8585 Encinitas Way
- 721 Cardiff St
- 7969 Royal Oak Place
- 366 Lausanne Dr
- 7358 Gribble St
- 177 Coralwood Dr
- 425 S Meadowbrook Dr Unit 124
- 7263 Aquamarine Rd
- 725 Peggy Dr
- 722 Osage St
- 8441 Parkbrook St
- 7449 Bullock Dr
- 8053 San Felipe St
- 8025 San Felipe St
- 8065 San Felipe St
- 8009 San Felipe St
- 390 Cates St
- 382 Cates St
- 7979 San Felipe St
- 8075 San Felipe St
- 8032 San Felipe St
- 8044 San Felipe St
- 391 Bowie St
- 8020 San Felipe St
- 8056 San Felipe St
- 374 Cates St
- 8008 San Felipe St
- 7967 San Felipe St
- 8107 San Felipe St
- 8068 San Felipe St
- 291 Middlebush Dr
- 7950 Shorewood Dr